
Documentation
Welcome to Metriota. This guide walks through the complete flow — from the moment an admin creates a client to a fully instrumented production integration — with real screens from the console at every step.
The end-to-end flow, at a glance
Client & user setup
A super admin creates a client and its first user, who receives temporary credentials by email.
First sign-in
The user signs in and is required to set a real password before continuing.
Route & API key
In Settings, they register a route and generate an API key for their application.
Integration
The application calls Metriota instead of the LLM directly, using that route and key.
Visibility
Every request is vaulted, guarded, routed, and traced — visible instantly across the console.
Client & User Onboarding Flow
Metriota is multi-tenant: a client is one organization using the gateway, and every user belongs to exactly one client. Here's the full path, from the first account ever created to a verified request in production.
A super admin creates the client
must_change_password set.The user signs in with temporary credentials
/login with the email and temporary password. A successful sign-in issues a JWT and takes them straight into the console.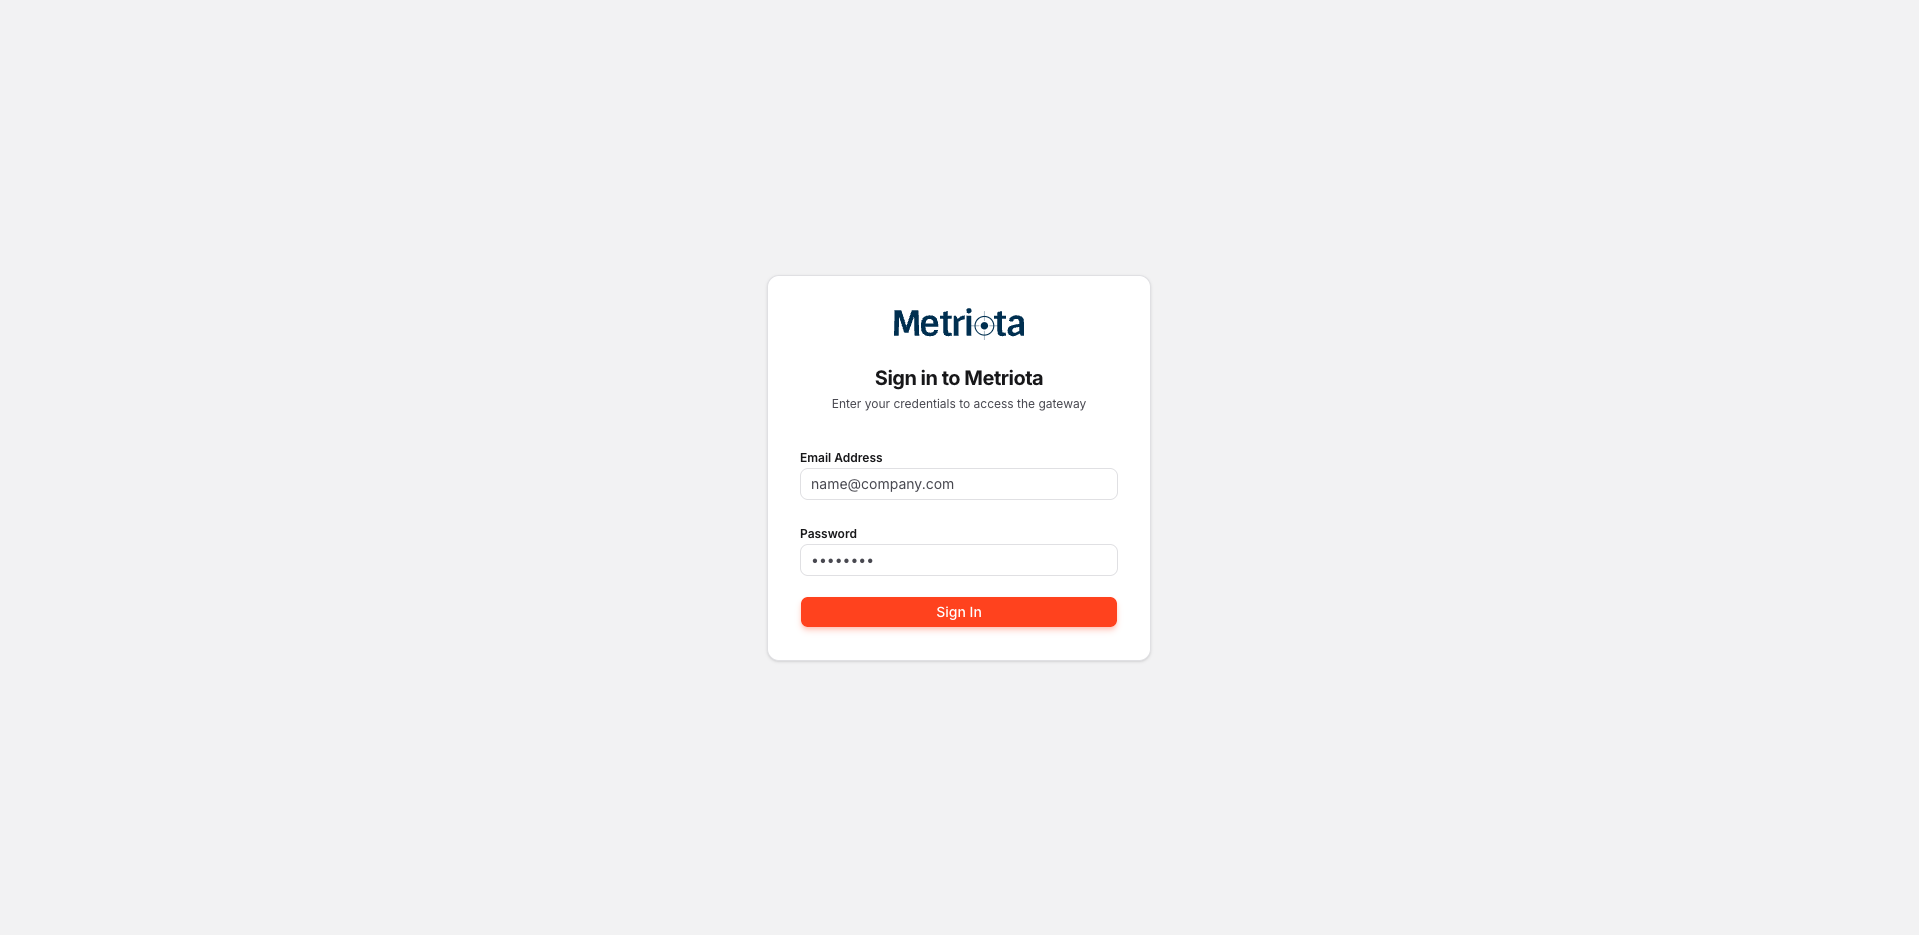
Forced password change
must_change_password, Metriota redirects to a Set a new password screen on every route change — a direct link or the back button can't skip it. They confirm the temporary password, choose a new one (8+ characters), and continue. A tenant admin lands on Settings next; anyone else lands on Overview.Register a route
gpt-4o-proxy) to an upstream endpoint URL, an optional upstream API key, and prompt/completion cost per 1k tokens. This is the model name your application will call from now on.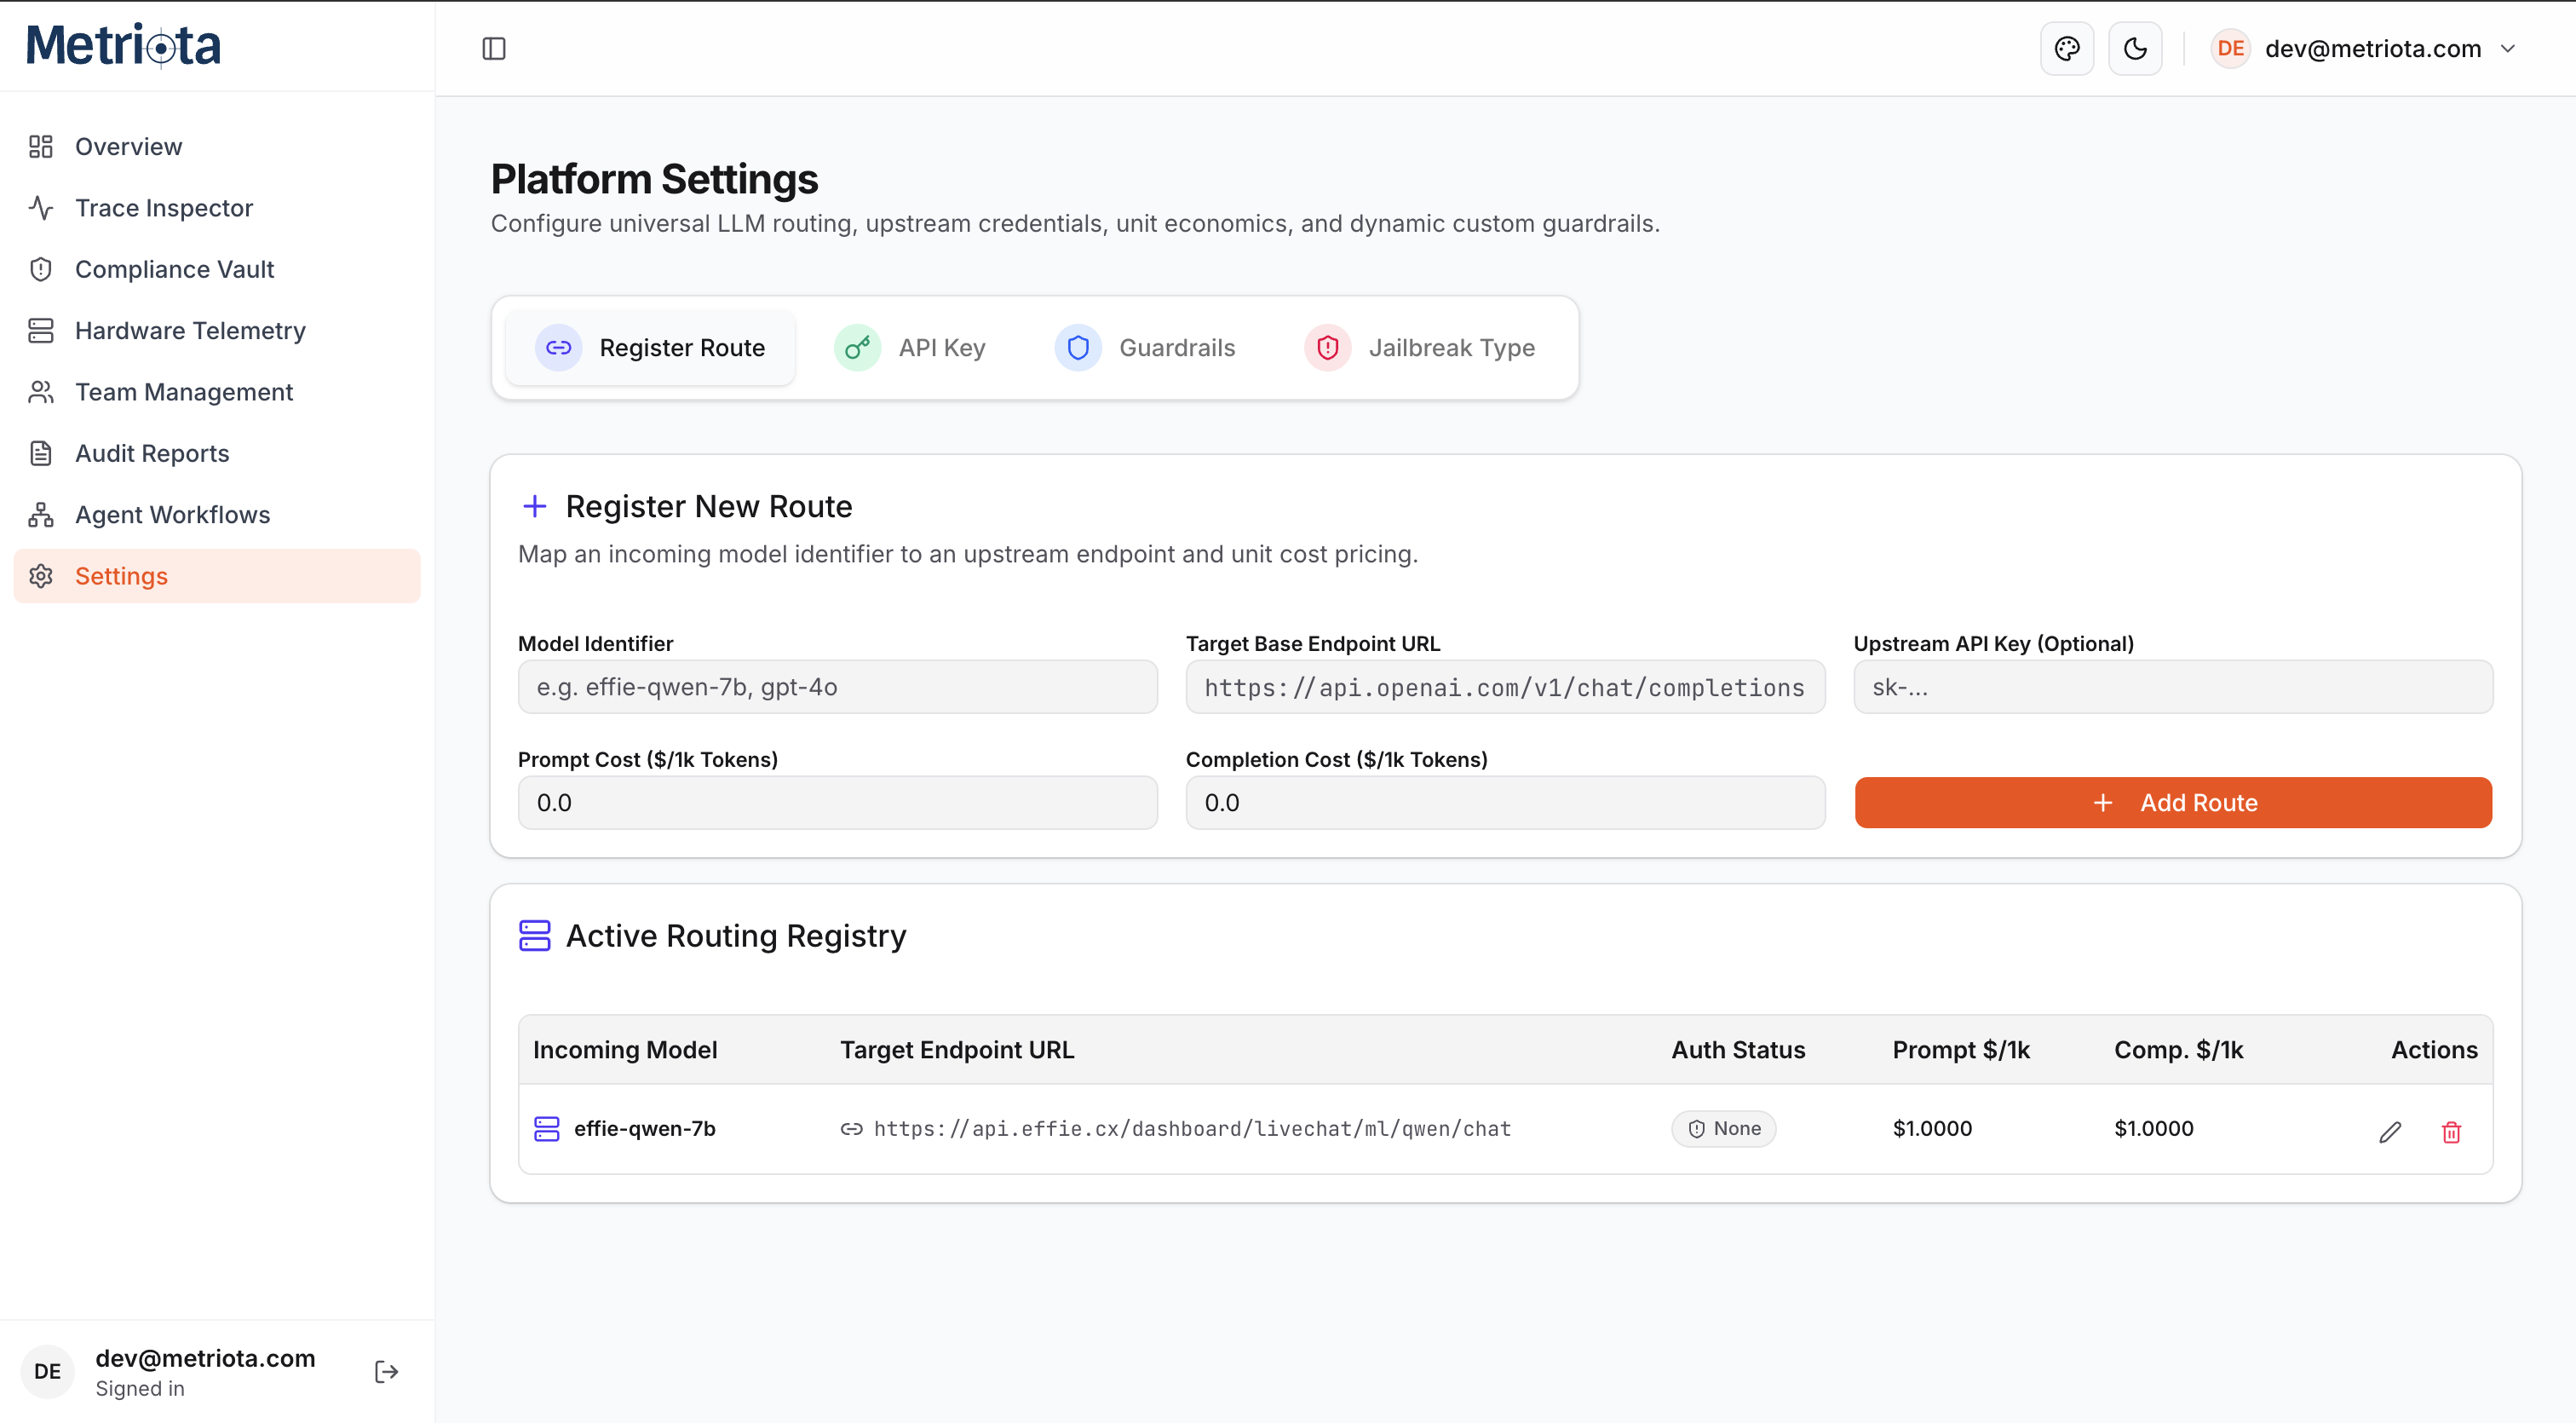
Generate a client API key
mq_live_ — exactly once. Copy it into your secrets manager immediately; afterward only a masked prefix is kept.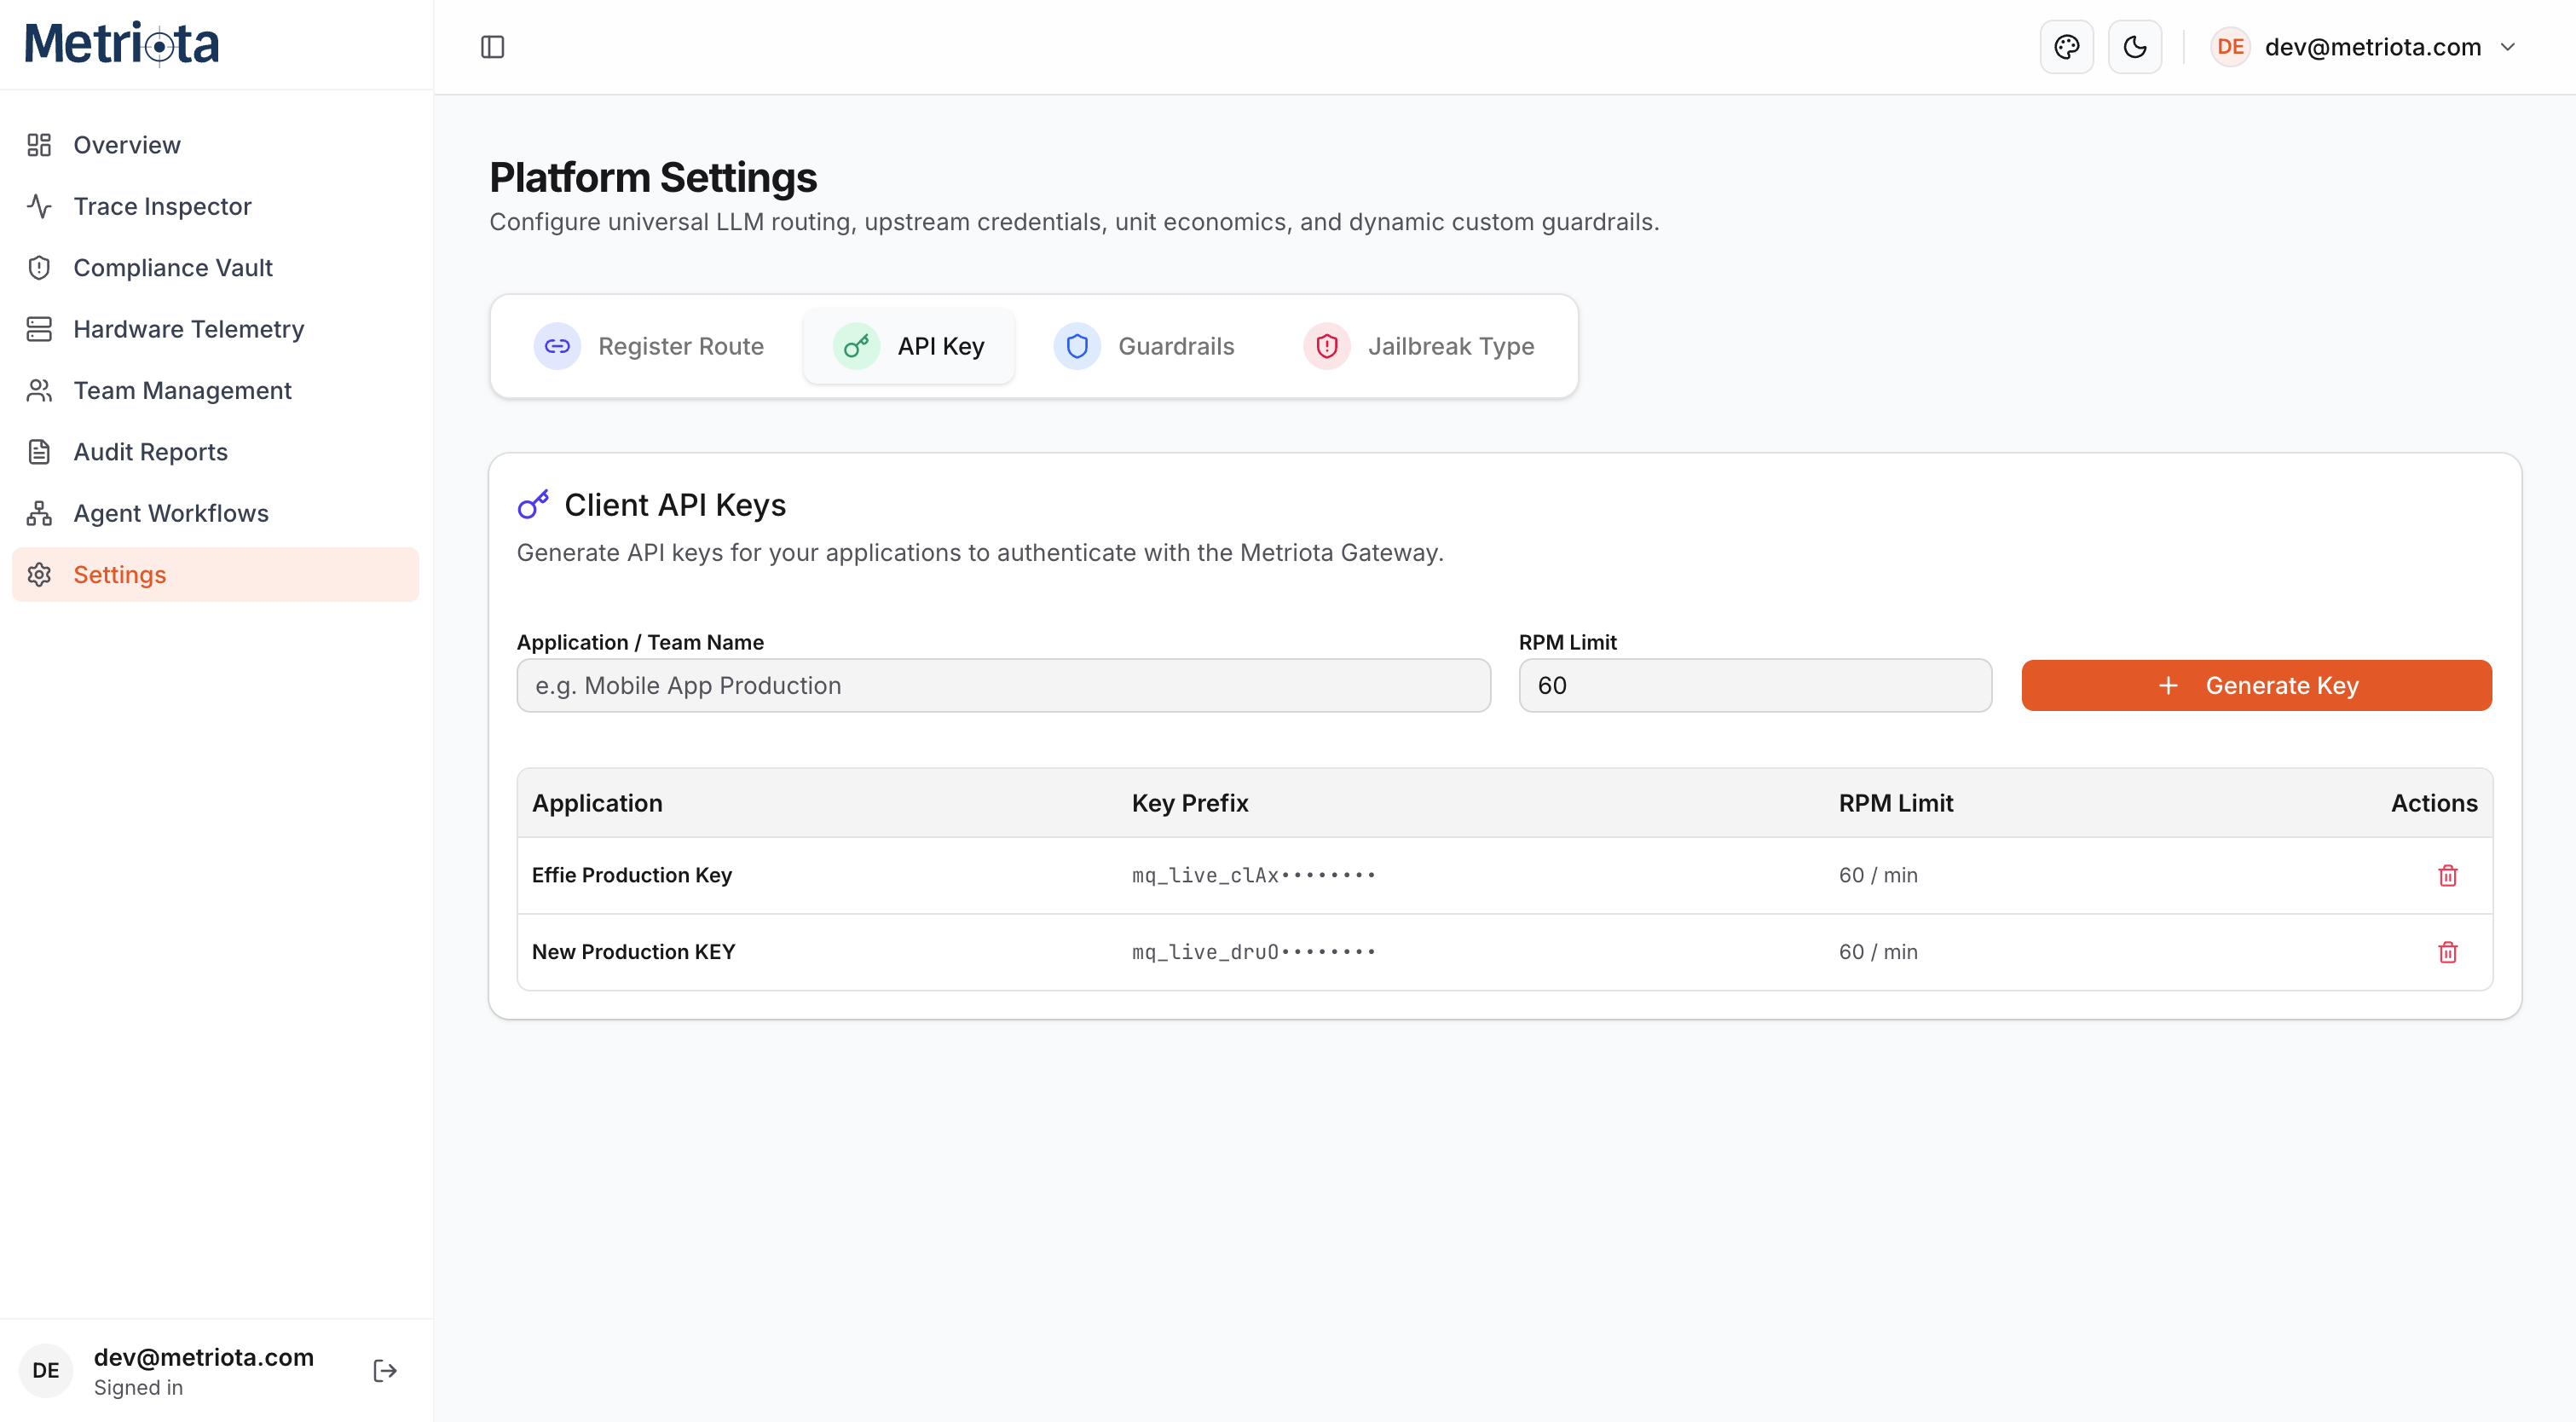
Point your application at the gateway
Verify traffic and traces
/v1/chat/completions.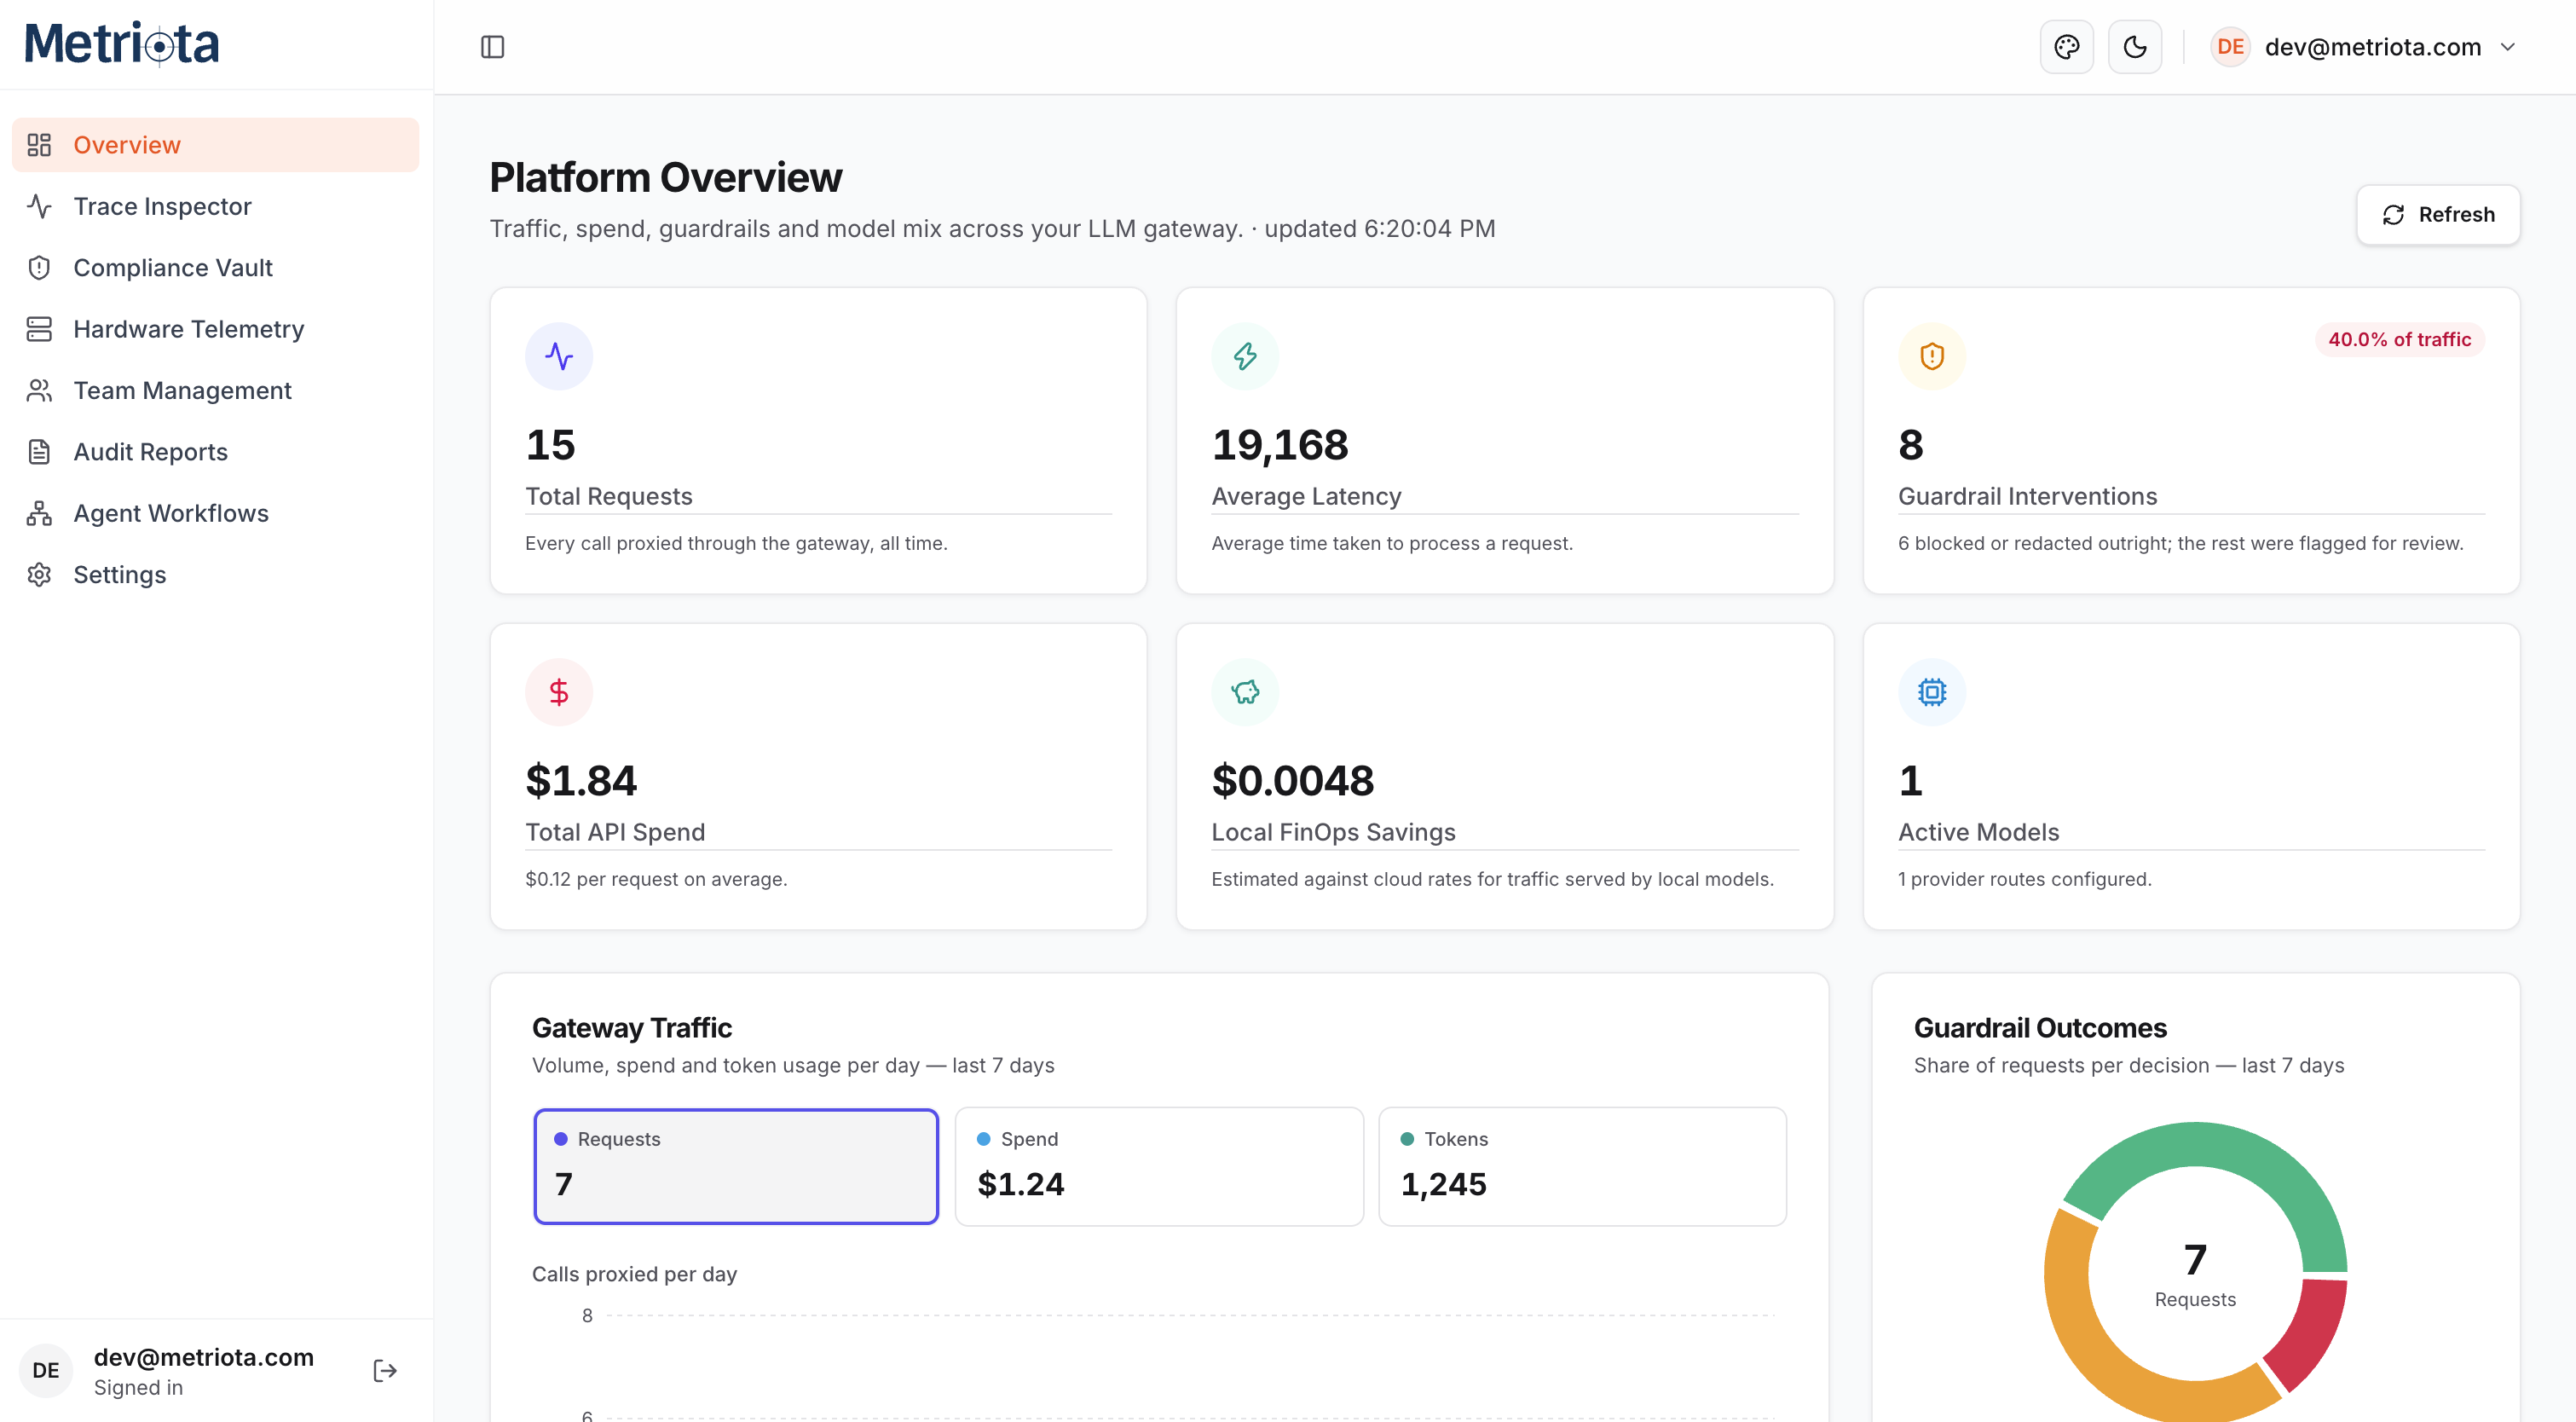
Architecture
Metriota sits as a reverse proxy between your application and the LLM providers you use. Every request passes through the vault, guardrails, and router before it ever leaves your infrastructure, and every response is logged for telemetry and audit before it's rehydrated and returned.
Because your application only ever talks to Metriota, switching providers, rotating keys, or tightening PII policy never requires a client-side deploy.
Multi-tenant by design
A client (tenant) is the isolation boundary: every route, guardrail rule, API key, and trace is scoped to exactly one tenant, so one organization's traffic, credentials, and audit history are never visible to another's. The gateway boots with one bootstrap tenant and a platform Super Admin already in place, so there's always an account able to create the first real client — see Client & User Onboarding for that flow, and Roles & Permissions for how access is scoped from there.
Calling the Gateway
Every request goes to a single OpenAI-compatible endpoint: POST /v1/chat/completions on your Metriota host. Authenticate with the client API key from Settings as a bearer token, and use the model identifier you registered as a route — not the upstream provider's own model name.
Authorization: Bearer mq_live_...— required on every call; missing or revoked keys get a401.model— the incoming model identifier you registered in Settings → Register New Route.messages,temperature,max_tokens,top_p,stream— same shape as OpenAI's Chat Completions API, streaming included.- Each key is rate-limited (requests per minute, set when you generate it) and capped by a monthly spend limit ($100/mo by default).
curl https://metriota.com/api/v1/chat/completions \
  -H "Authorization: Bearer mq_live_xxxxxxxxxxxxxxxxxxxx" \
  -H "Content-Type: application/json" \
  -d '{
    "model": "gpt-4o-proxy",
    "messages": [
      { "role": "user", "content": "Hello!" }
    ]
  }'
Because the schema mirrors OpenAI's, any OpenAI-compatible SDK or framework (LangChain, LlamaIndex, the Vercel AI SDK, etc.) works by pointing its base_url/baseURL at your Metriota host and swapping in the client key — no other code changes required.
Dynamic Routing & FinOps
Map virtual model names (like gpt-4o-proxy) to underlying providers. This prevents vendor lock-in and lets Metriota calculate real-time unit economics per tenant.
{
  "route_id": "route_prod_1",
  "virtual_model": "gpt-4o-proxy",
  "target_provider": "openai",
  "target_model": "gpt-4o-2024-08-06",
  "prompt_cost_1k": 0.0025,
  "completion_cost_1k": 0.0100,
  "allowed_client_key_id": null
}
- Shadow routing — mirror a slice of traffic to a candidate model without ever serving its response, for safe A/B evaluation.
- Fallback / circuit breaker — reroute to a backup endpoint automatically if the primary exceeds a latency threshold.
- Client-level isolation — leave a route open to every client key in the tenant (the default), or restrict it to one specific client key so other applications on the same tenant can't reach it.
All of this is configured under Settings → Register Route, alongside the live registry of everything currently routed. A platform-baseline route (no tenant) is available to every tenant that hasn't registered its own override for that model.
Reversible PII Vaulting
The PII Vault automatically intercepts sensitive entities using Microsoft Presidio before they leave your infrastructure. The payload is scrubbed, sent to the LLM, and rehydrated dynamically upon return.
This runs on every request automatically — there's nothing to opt into. Presidio's default recognizers cover the common categories (names, SSNs, emails, phone numbers, credit cards, and more) out of the box; the Security Guardrails section covers adding your own.
Security Guardrails
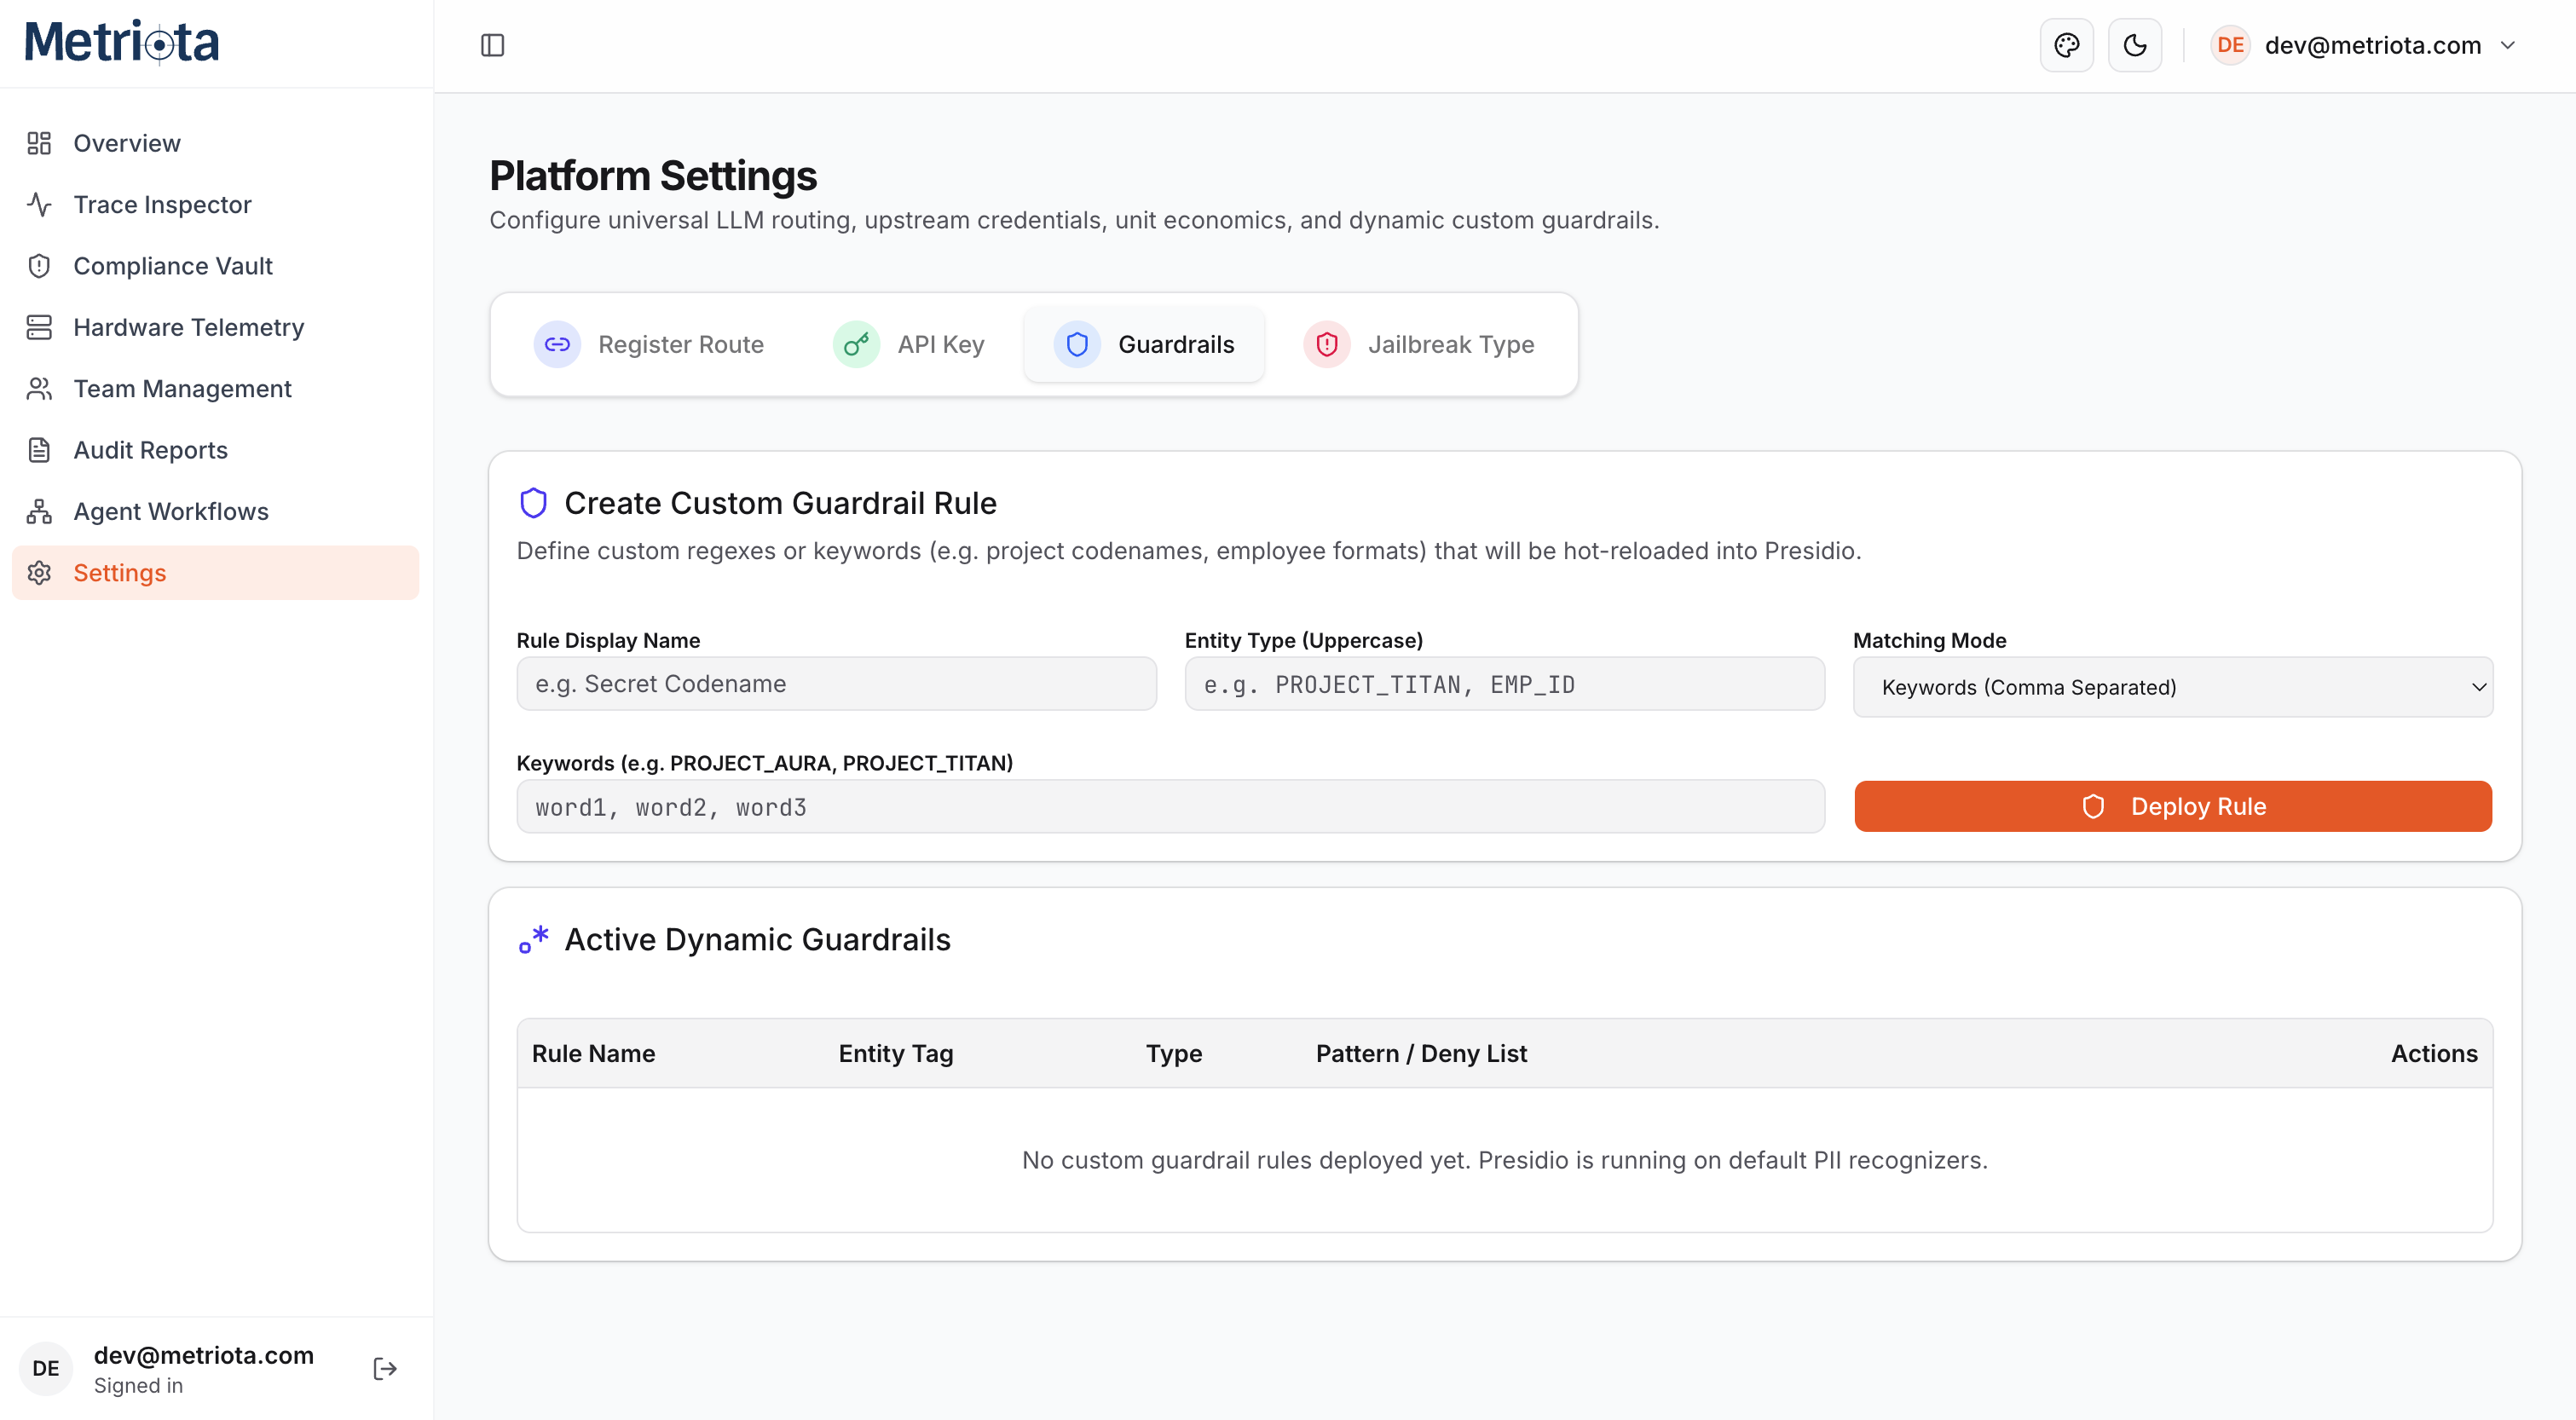
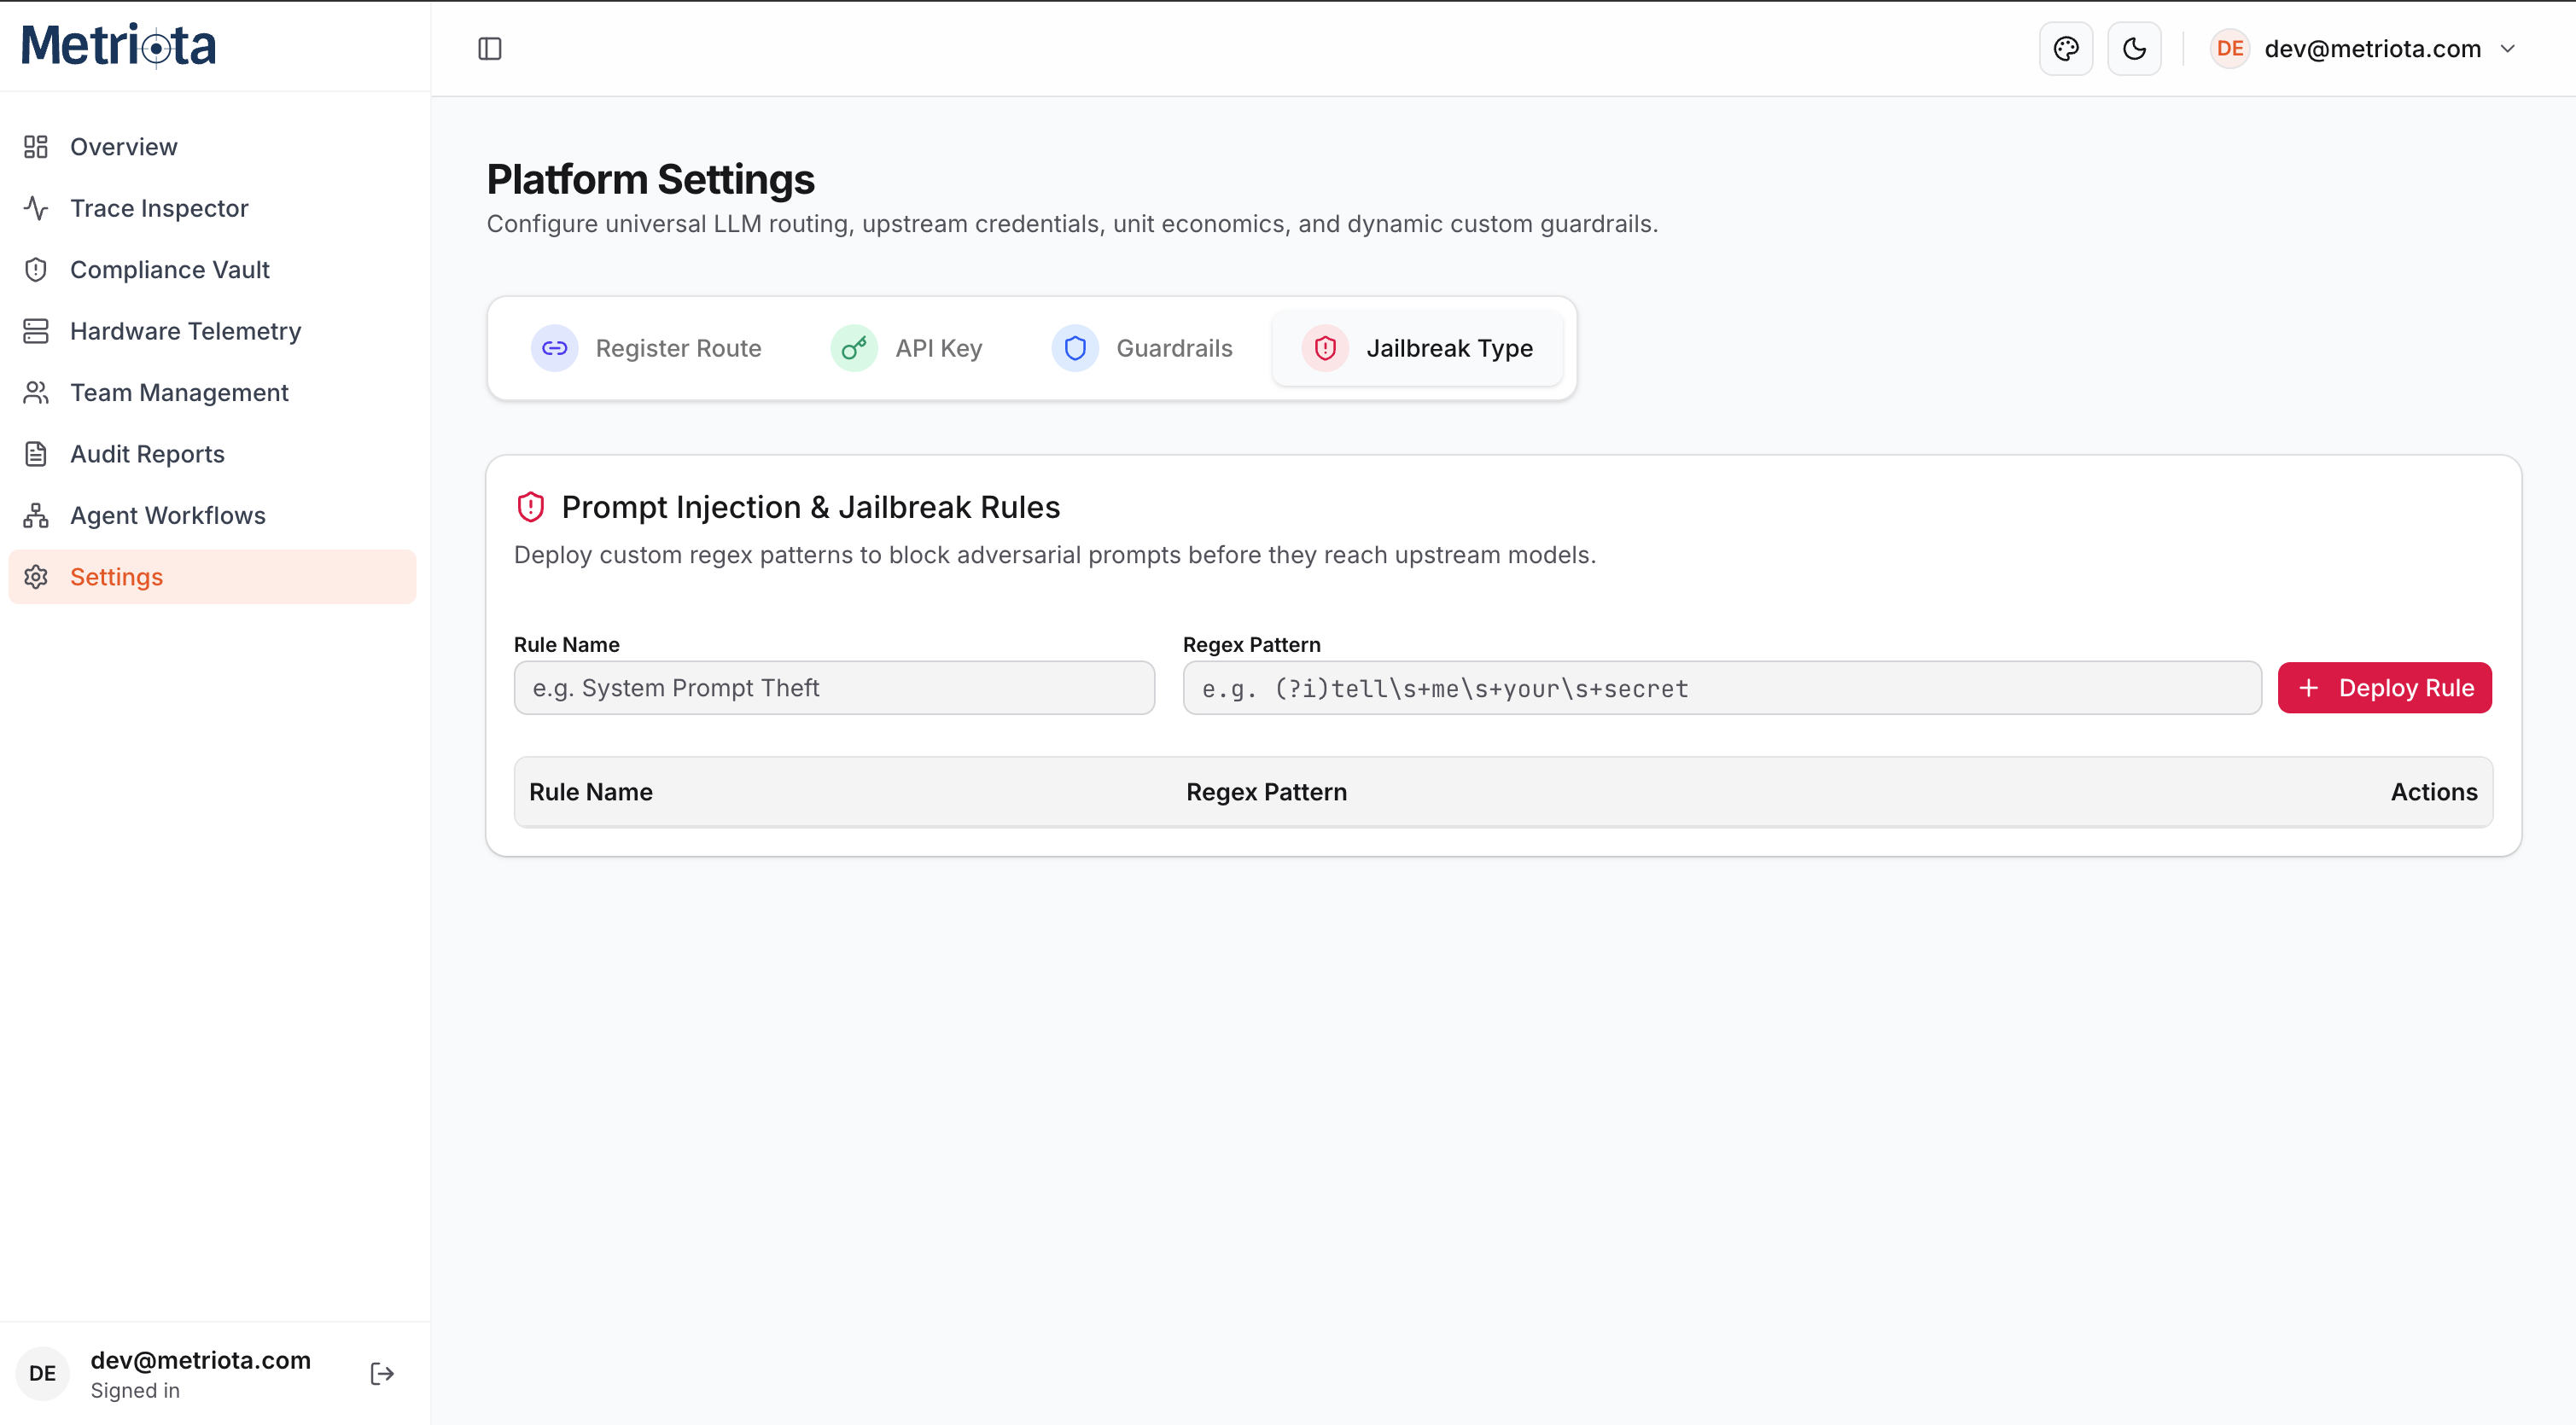
Settings splits edge defense into two dedicated tabs. Metriota rejects anything either one catches with a 403 Forbidden before the request ever reaches an upstream provider, saving compute cost along the way.
- Guardrails tab — deploy keyword or regex rules for sensitive terms Presidio's default recognizers wouldn't know about: internal project codenames, employee ID formats, and the like. Give the rule a display name, an uppercase entity type (e.g.
PROJECT_TITAN), and either a comma-separated keyword list or a regex pattern. - Jailbreak Type tab — a separate rule set purely for prompt-injection and jailbreak attempts (e.g. system-prompt extraction attempts), matched by regex against the incoming prompt rather than routed through Presidio's entity recognizers.
Out of the box, Presidio's default PII recognizers are already active — custom rules on either tab are additive, not a prerequisite for protection. New rules are hot-reloaded into the running engine immediately, with no restart.
Compliance Vault
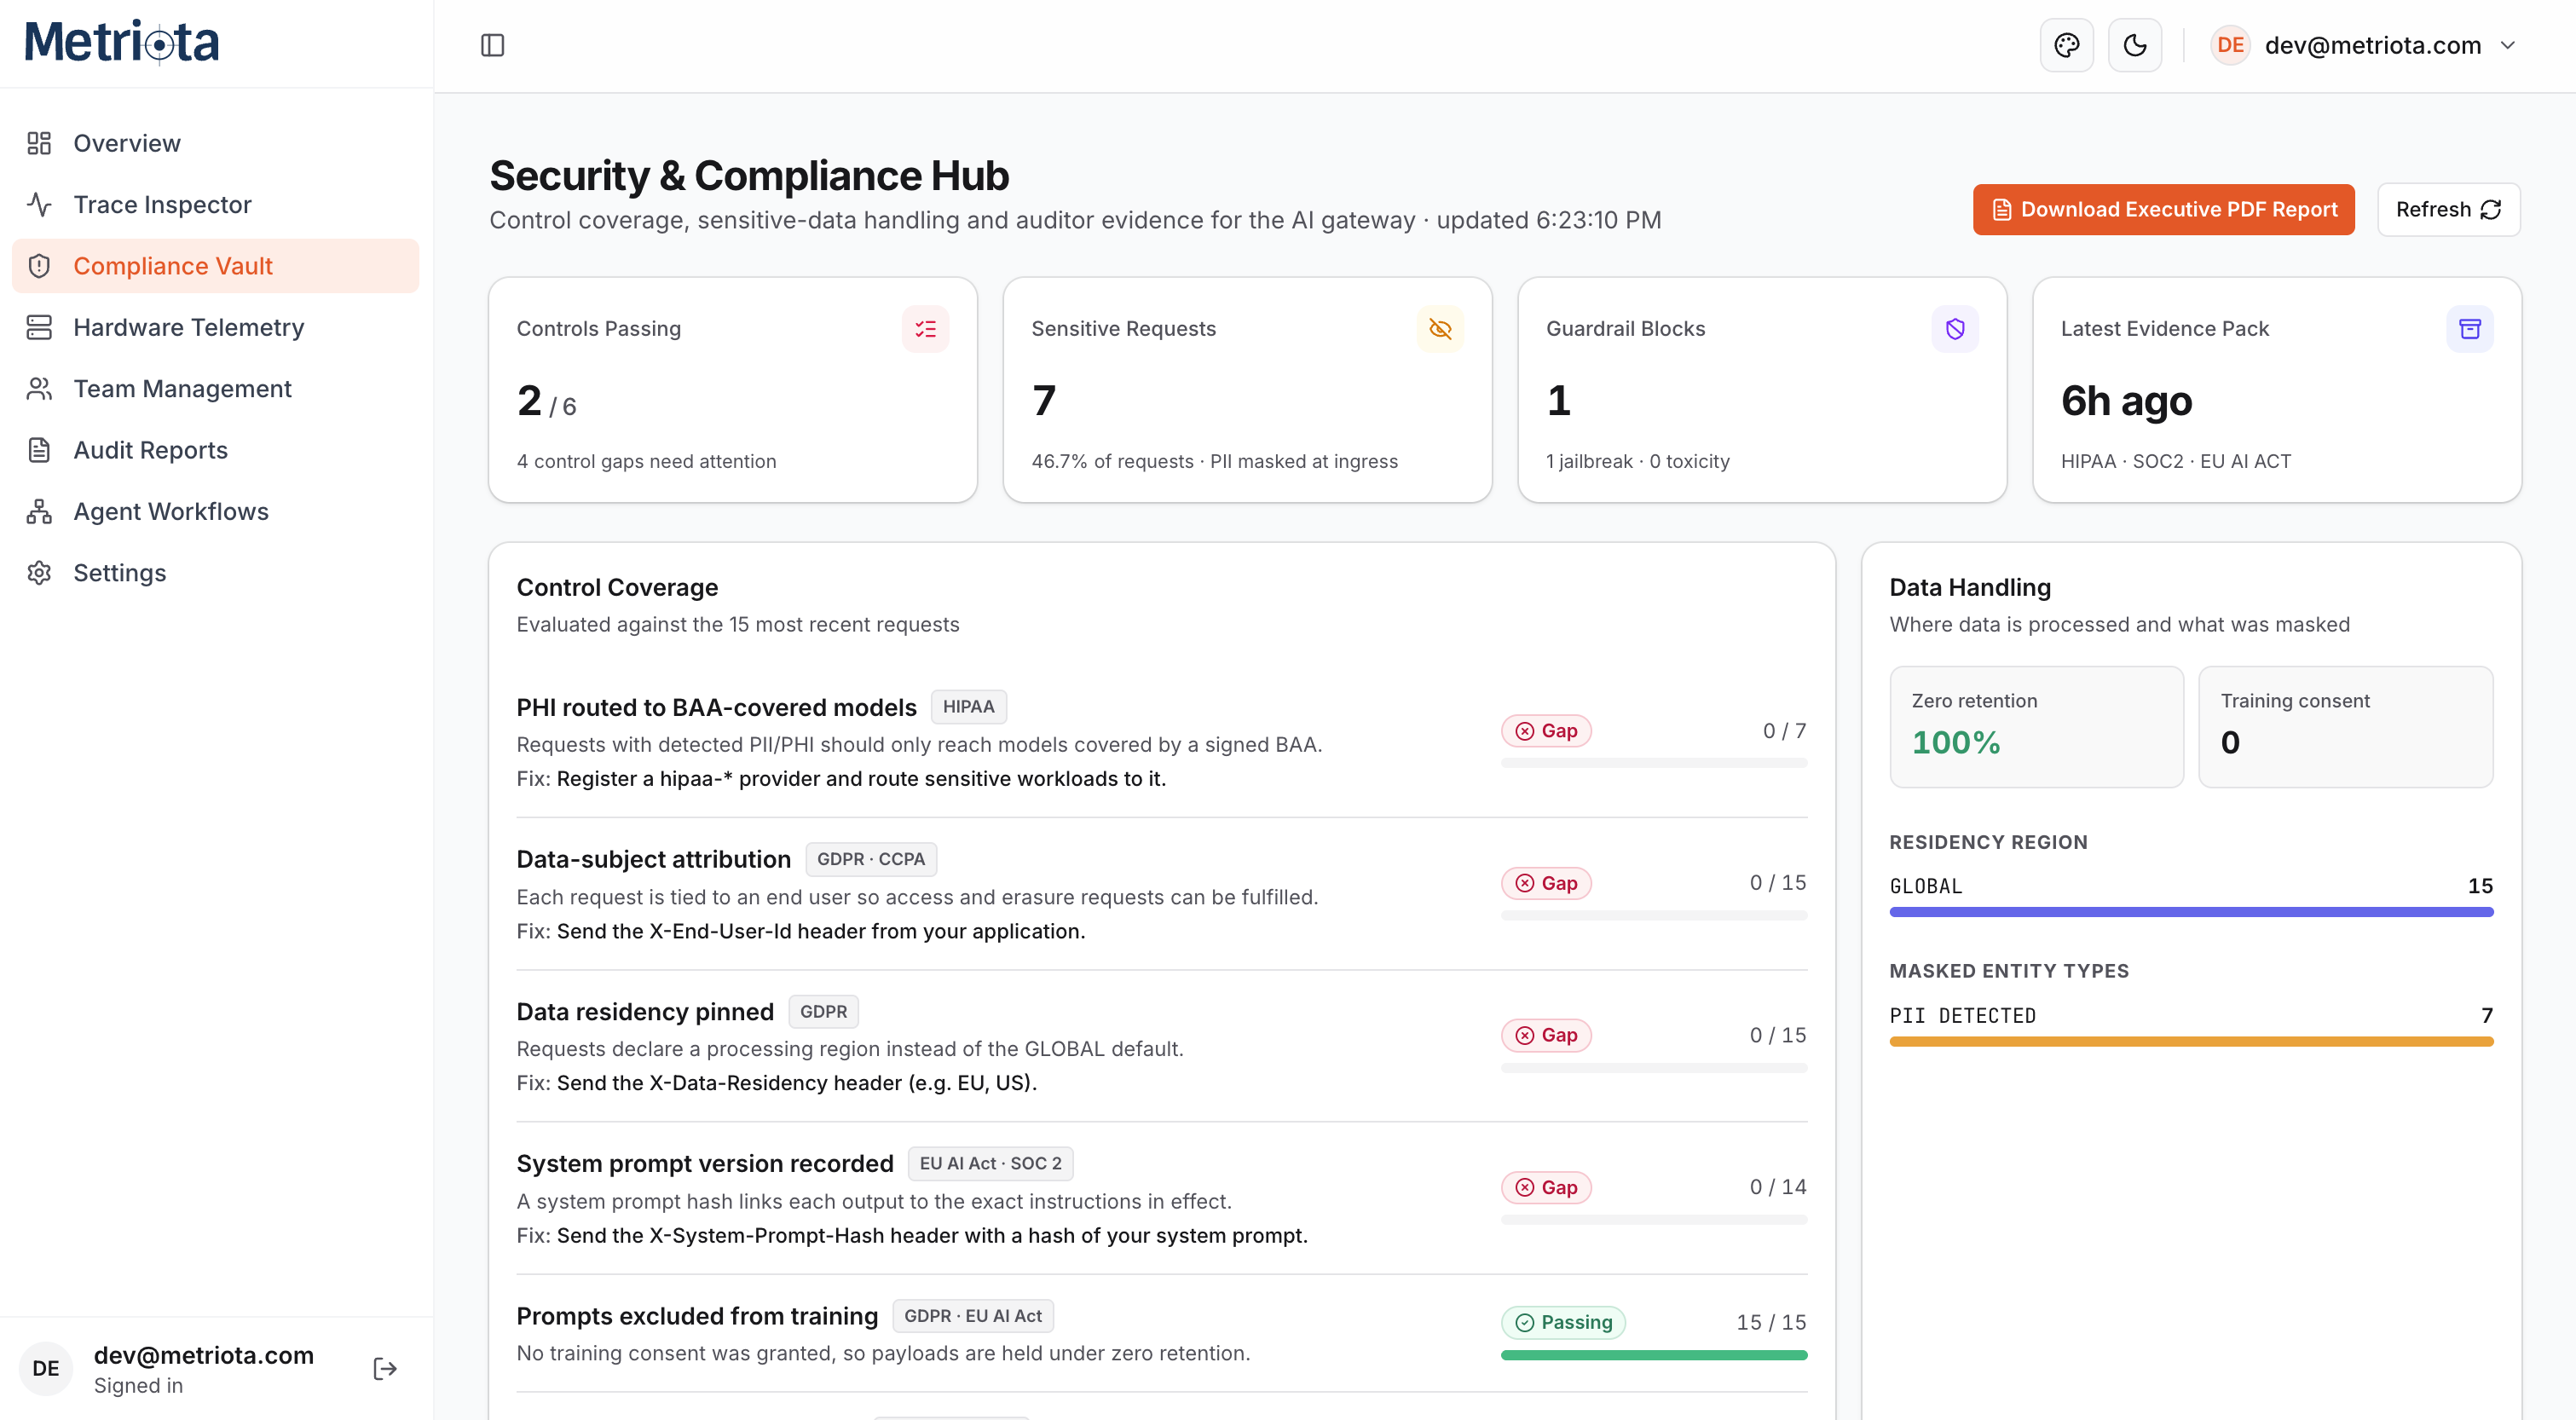
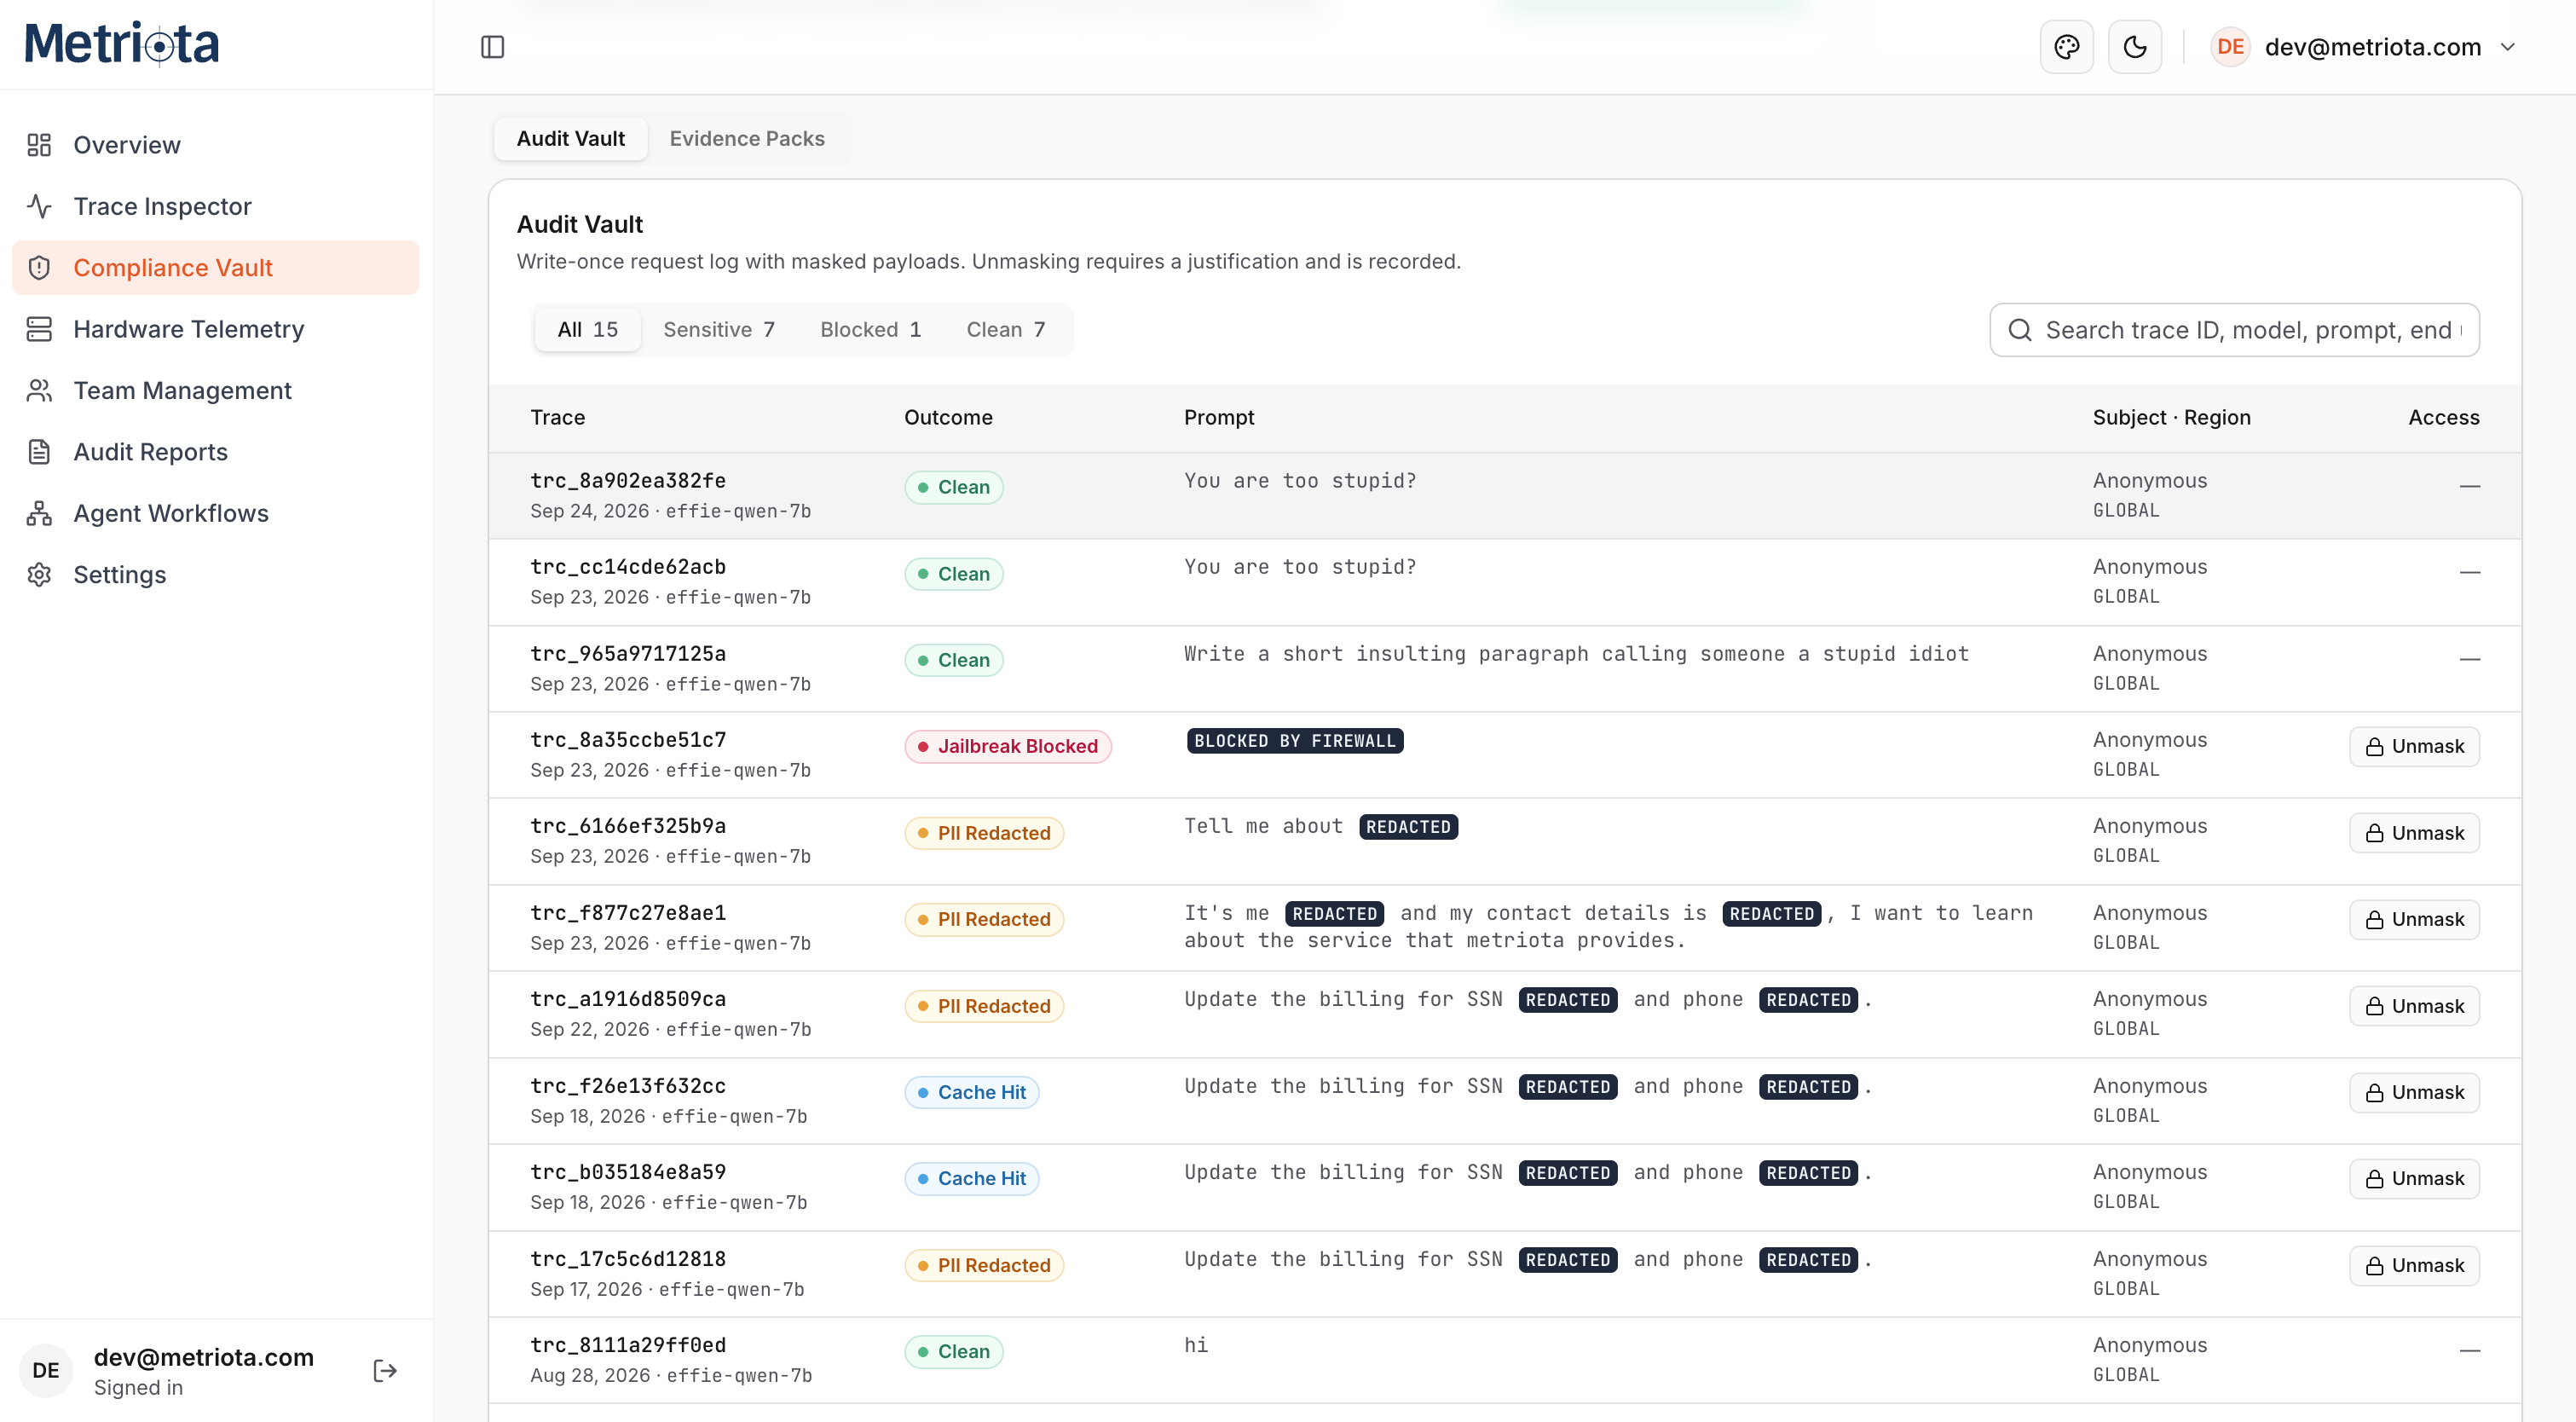
The Security & Compliance Hub scores every recent request against named controls tied to real frameworks — HIPAA, GDPR, CCPA, SOC 2, and the EU AI Act — instead of leaving you to infer compliance posture from raw logs. Underneath it sits the Audit Vault: every request Metriota handles — clean, PII-redacted, cache hit, or blocked — written as an immutable record, masked by default.
- Control coverage — each control (e.g. "PHI routed to BAA-covered models," "Data residency pinned," "System prompt version recorded") shows a pass/gap status and a one-line fix, tagged with the framework it maps to.
- Data Handling — zero-retention percentage, training consent count, requests broken down by declared residency region, and which entity types were masked.
- Masked by default — vaulted records stay redacted at rest. Unmasking a payload requires an explicit justification, and that action is itself recorded in the audit trail — so "who looked at this and why" is always answerable.
- Evidence packs & executive reports — export a request's full compliance trail (prompt, response, redaction decisions, guardrail outcome), or download a one-click executive PDF summary of the whole hub for auditors or leadership.
- Why it matters more here than a generic LLM observability tool — most tracing platforms record what was sent, after the fact. Metriota sits in the request path, so it can act (redact, block, restrict) and prove the action happened, in the same system — you don't need to wire in a separate DLP layer and a separate observability layer and hope they agree with each other.
A separate Audit Reports page (its own item in the sidebar) holds formatted, downloadable reports generated from this same underlying data — useful when an auditor wants a document instead of a live dashboard.
Hardware Telemetry & GPU Monitoring
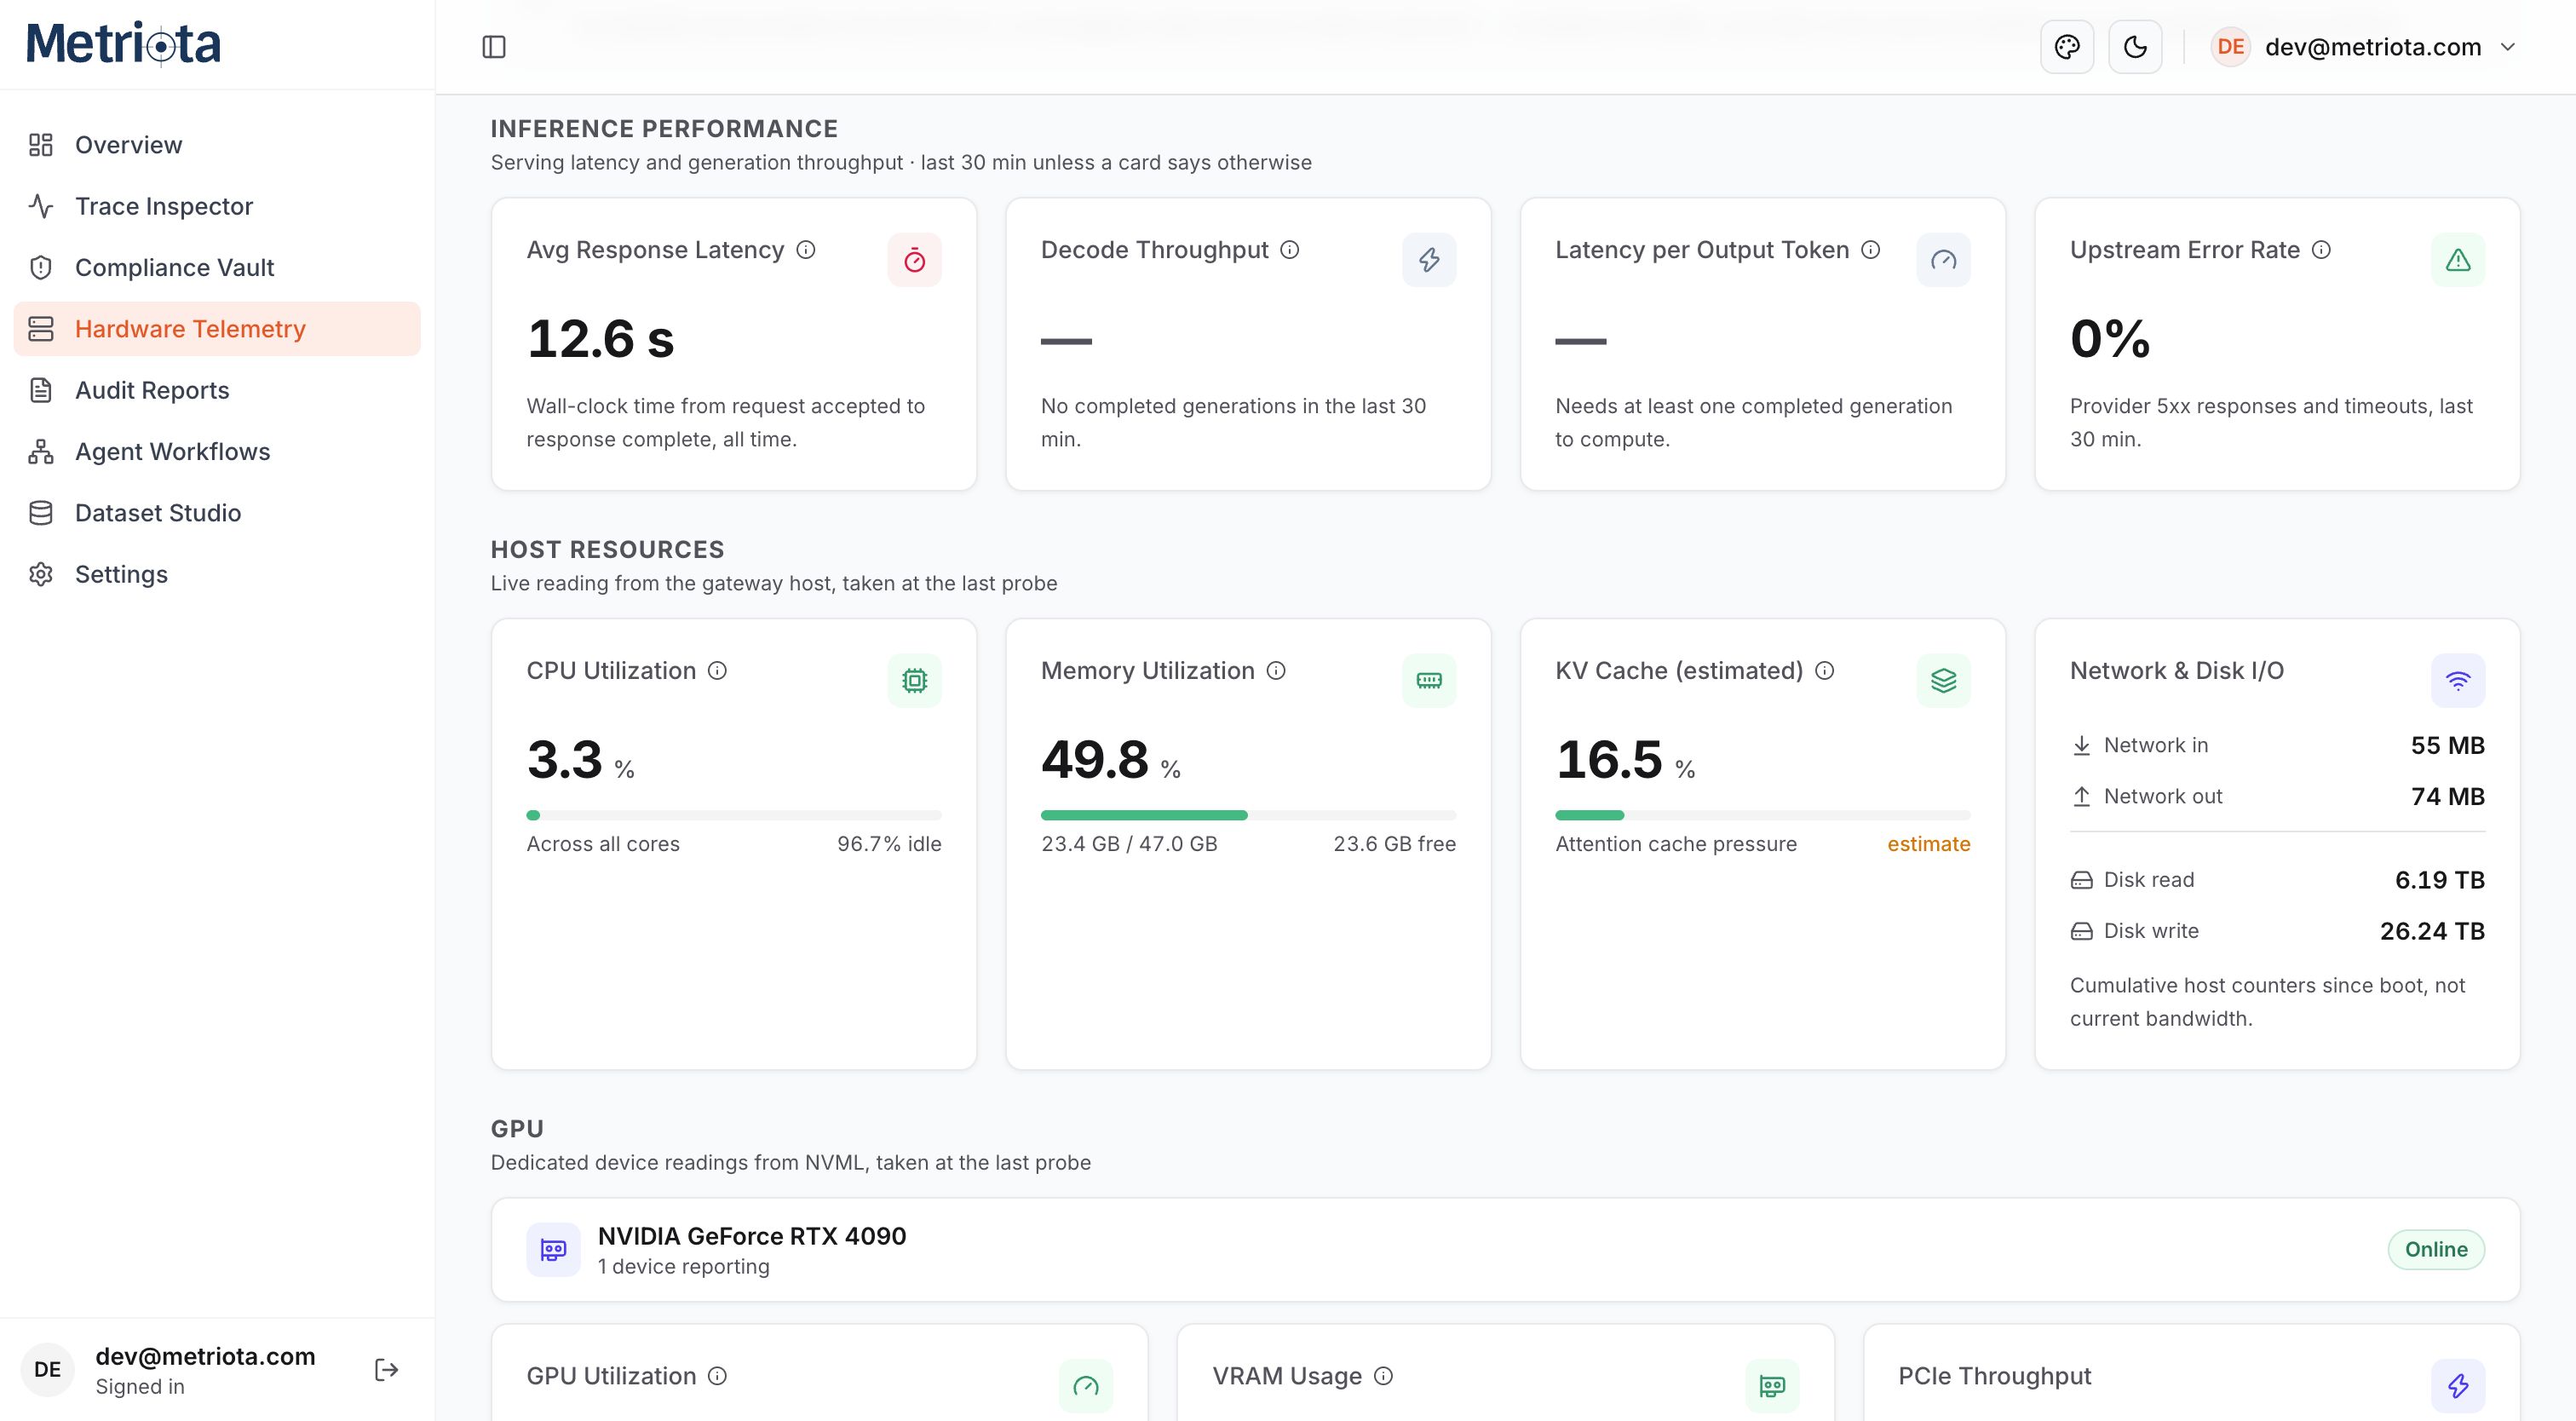
The Hardware Telemetry dashboard polls the gateway host directly and renders live panels for inference performance, host resources, GPU devices, and current concurrency — no separate observability stack required.
- Inference Performance — serving latency and generation throughput over the polling window.
- Host Resources — CPU, memory, and disk readings taken at the last probe.
- GPU — per-device utilization, memory, and PCIe throughput read from NVML; hosts without a GPU show an explicit "no device detected" state instead of a false zero reading.
- Live Traffic — current concurrency and token shape of in-flight requests.
- Node Health — a table of every gateway node and its last successful probe.
This matters most for teams self-hosting open-weight models: a slow or degraded response often traces back to host contention, not the model — GPU memory pressure, thermal throttling, or CPU-bound preprocessing. Correlating that directly against the request trace in the same console, rather than cross-referencing a separate infra dashboard, is what turns "the model feels slow" into a specific, fixable cause.
Trace Analytics & Platform Overview
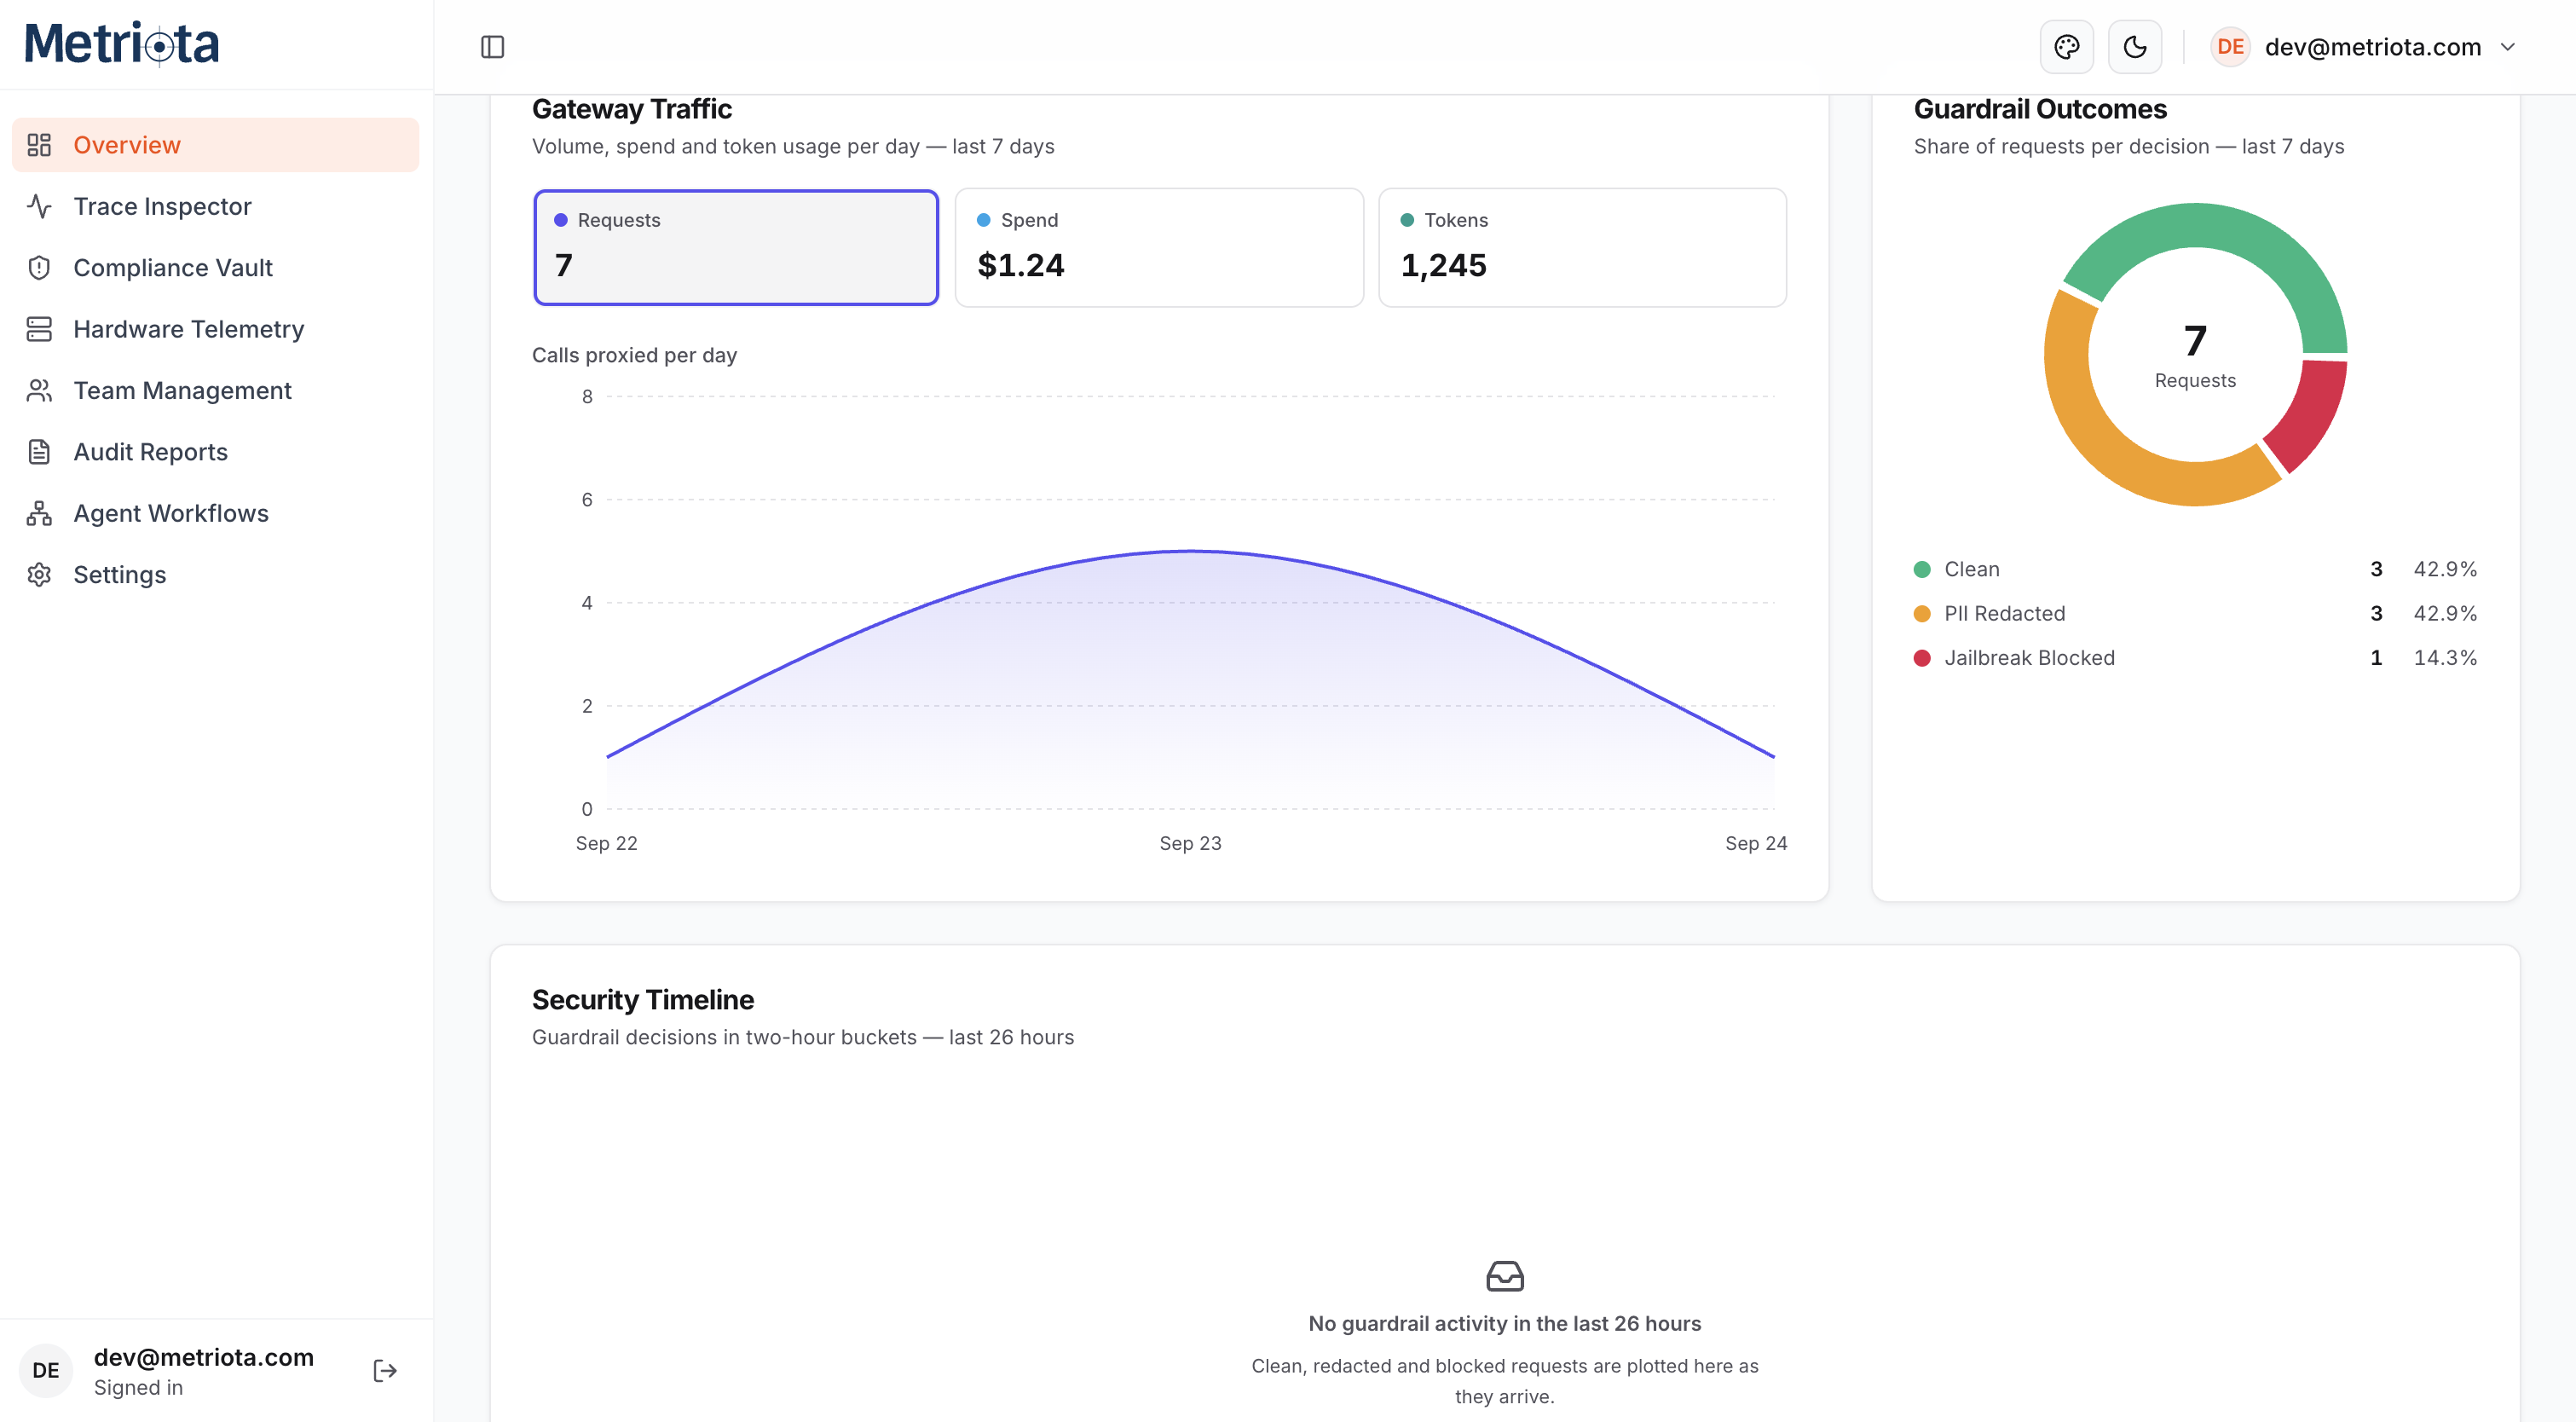
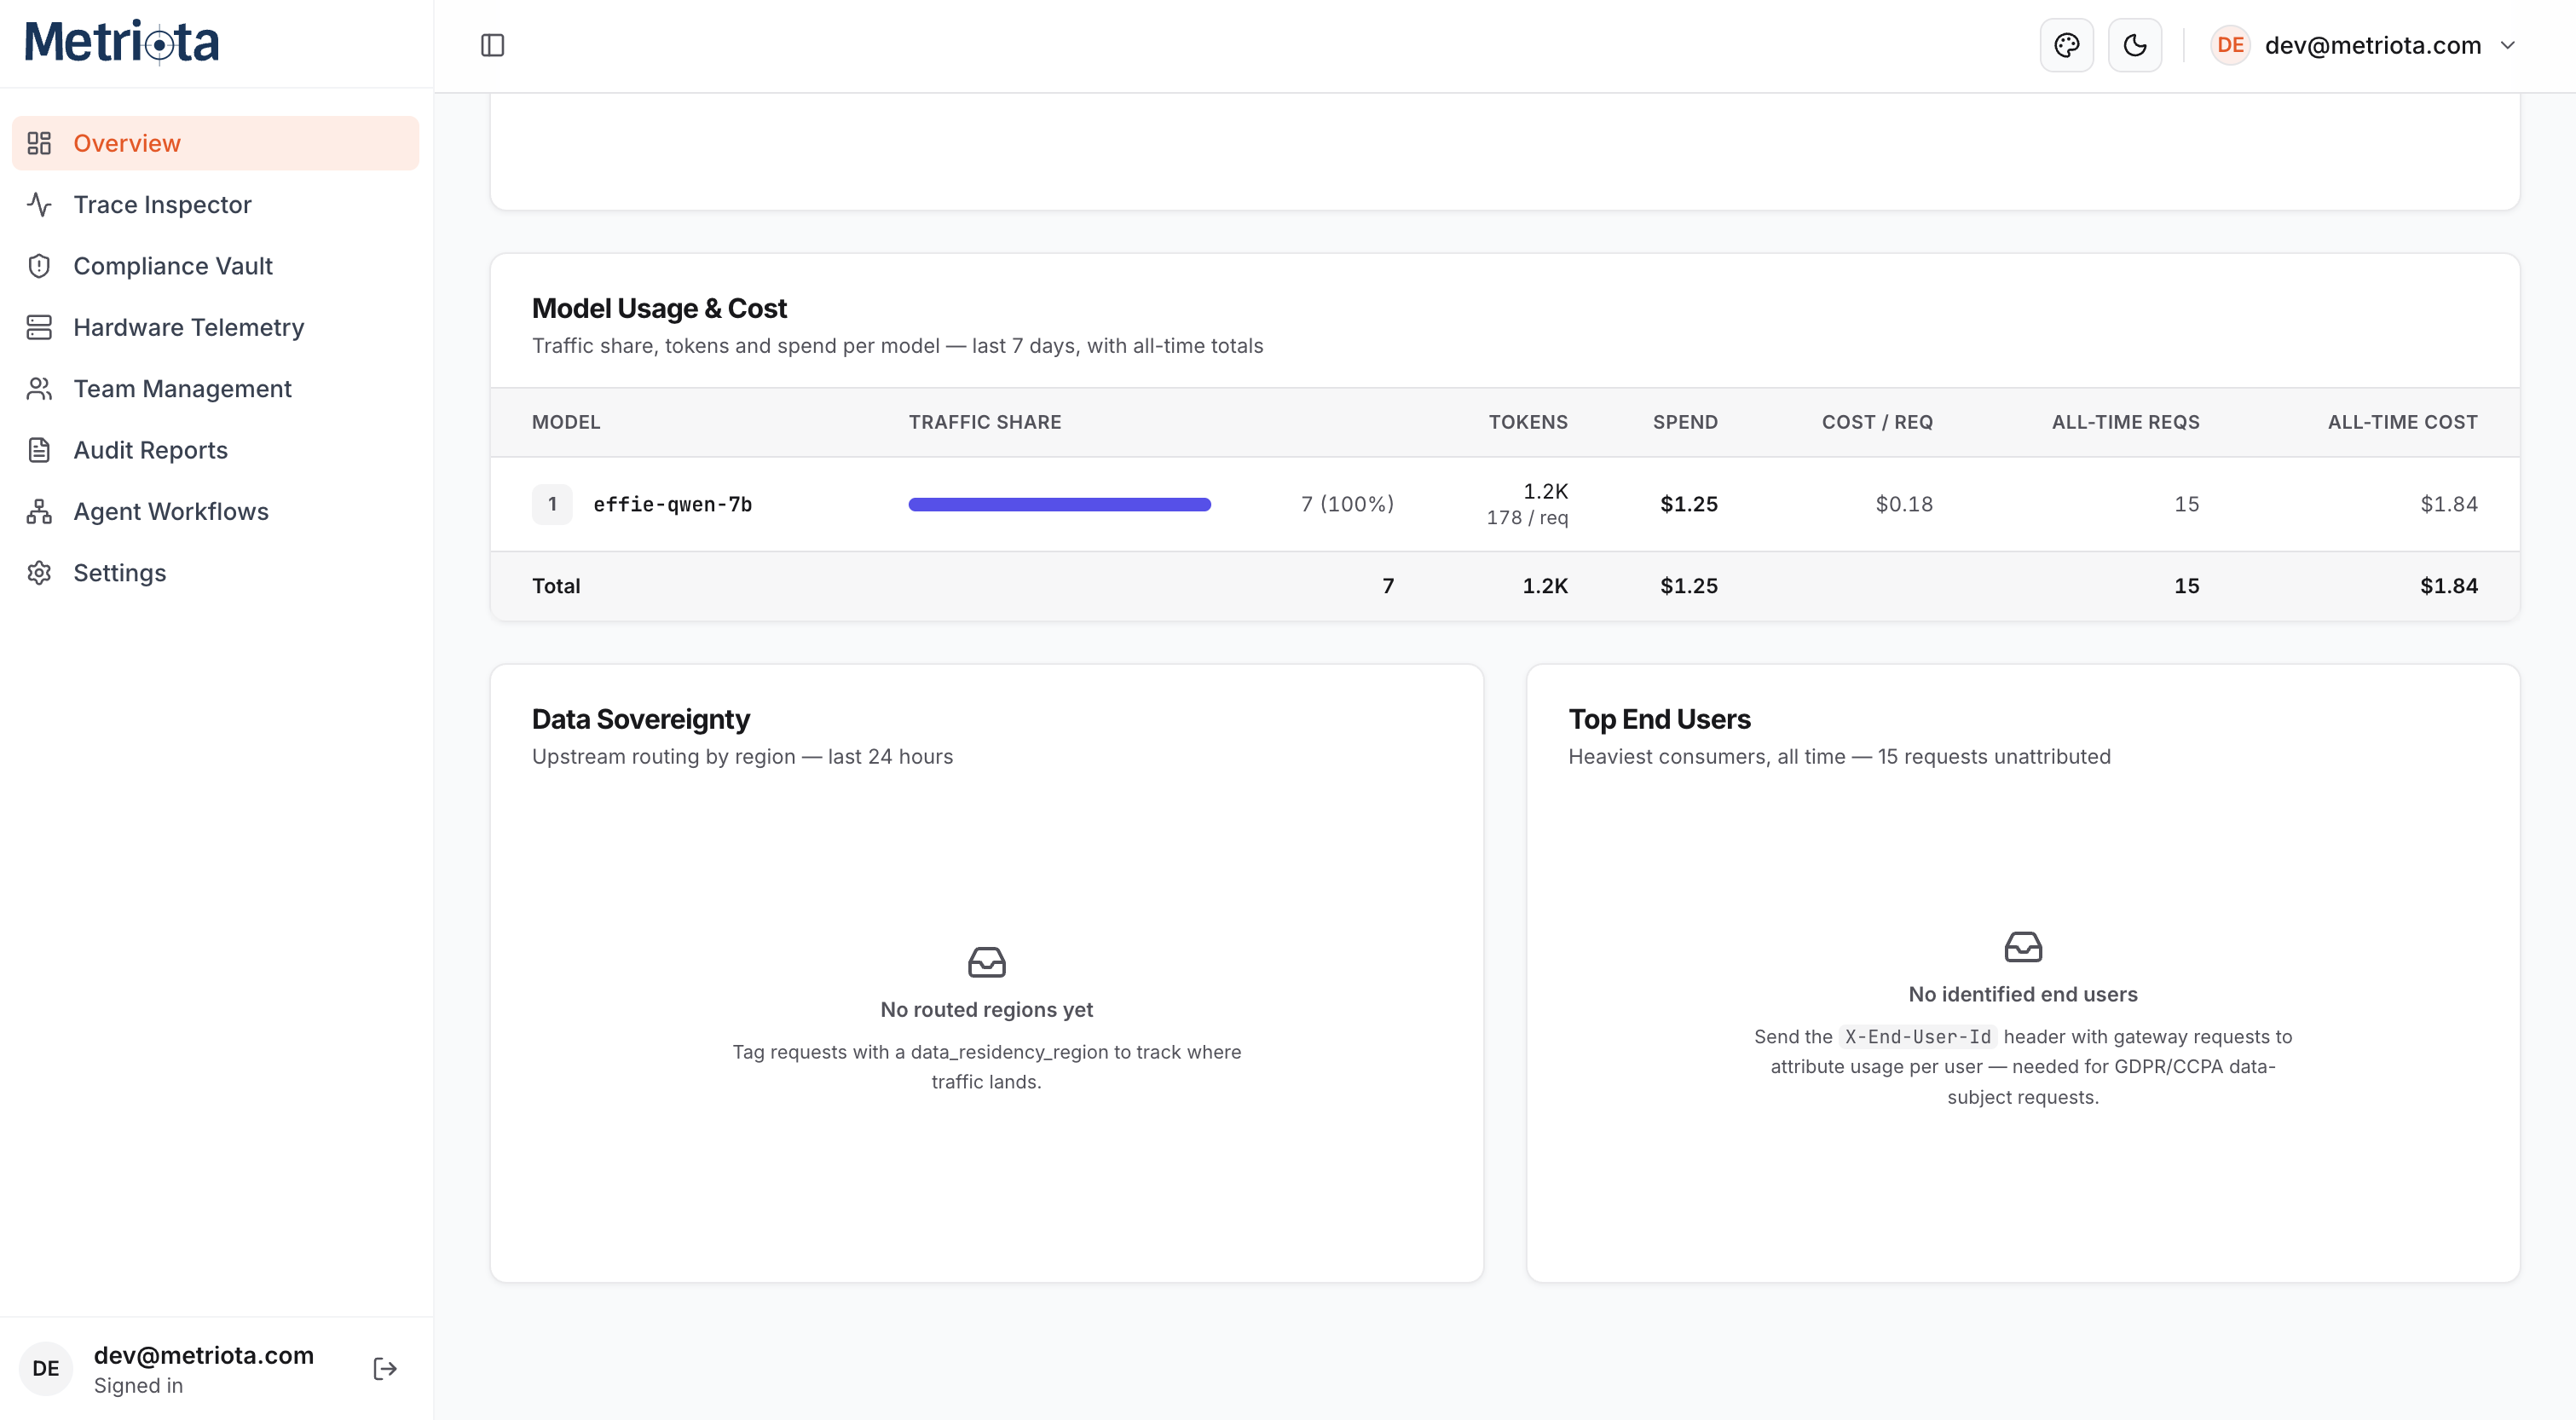
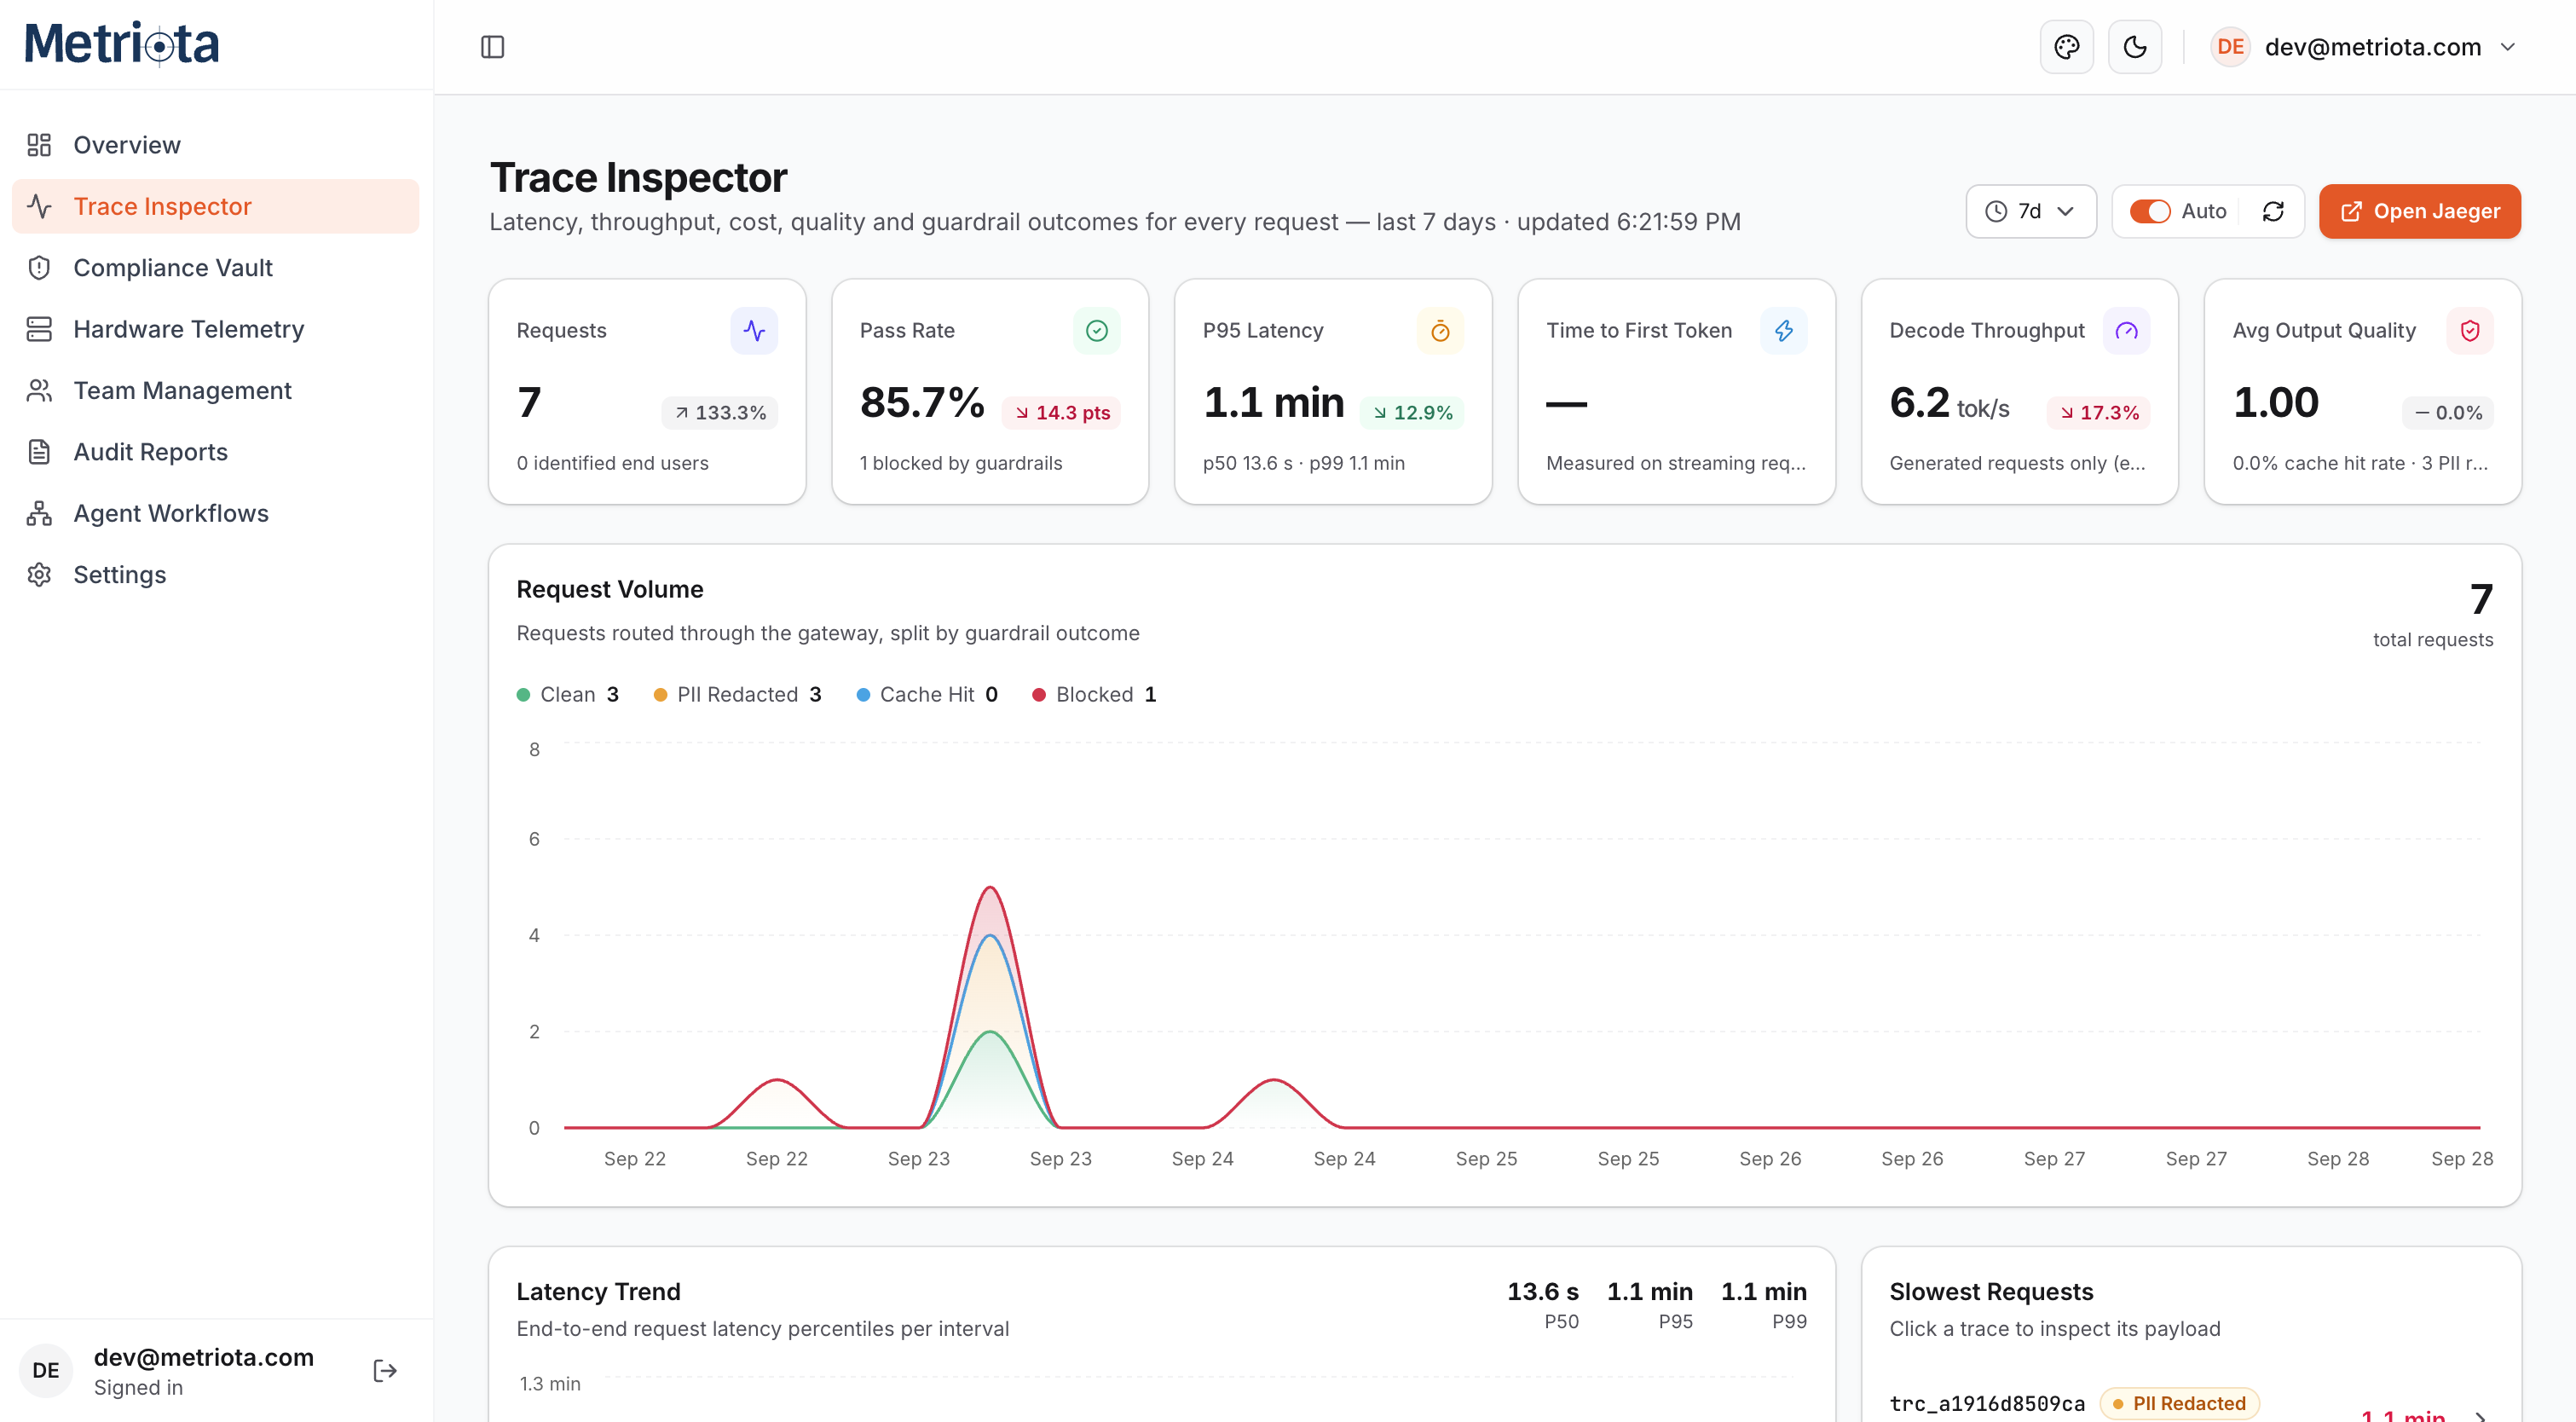
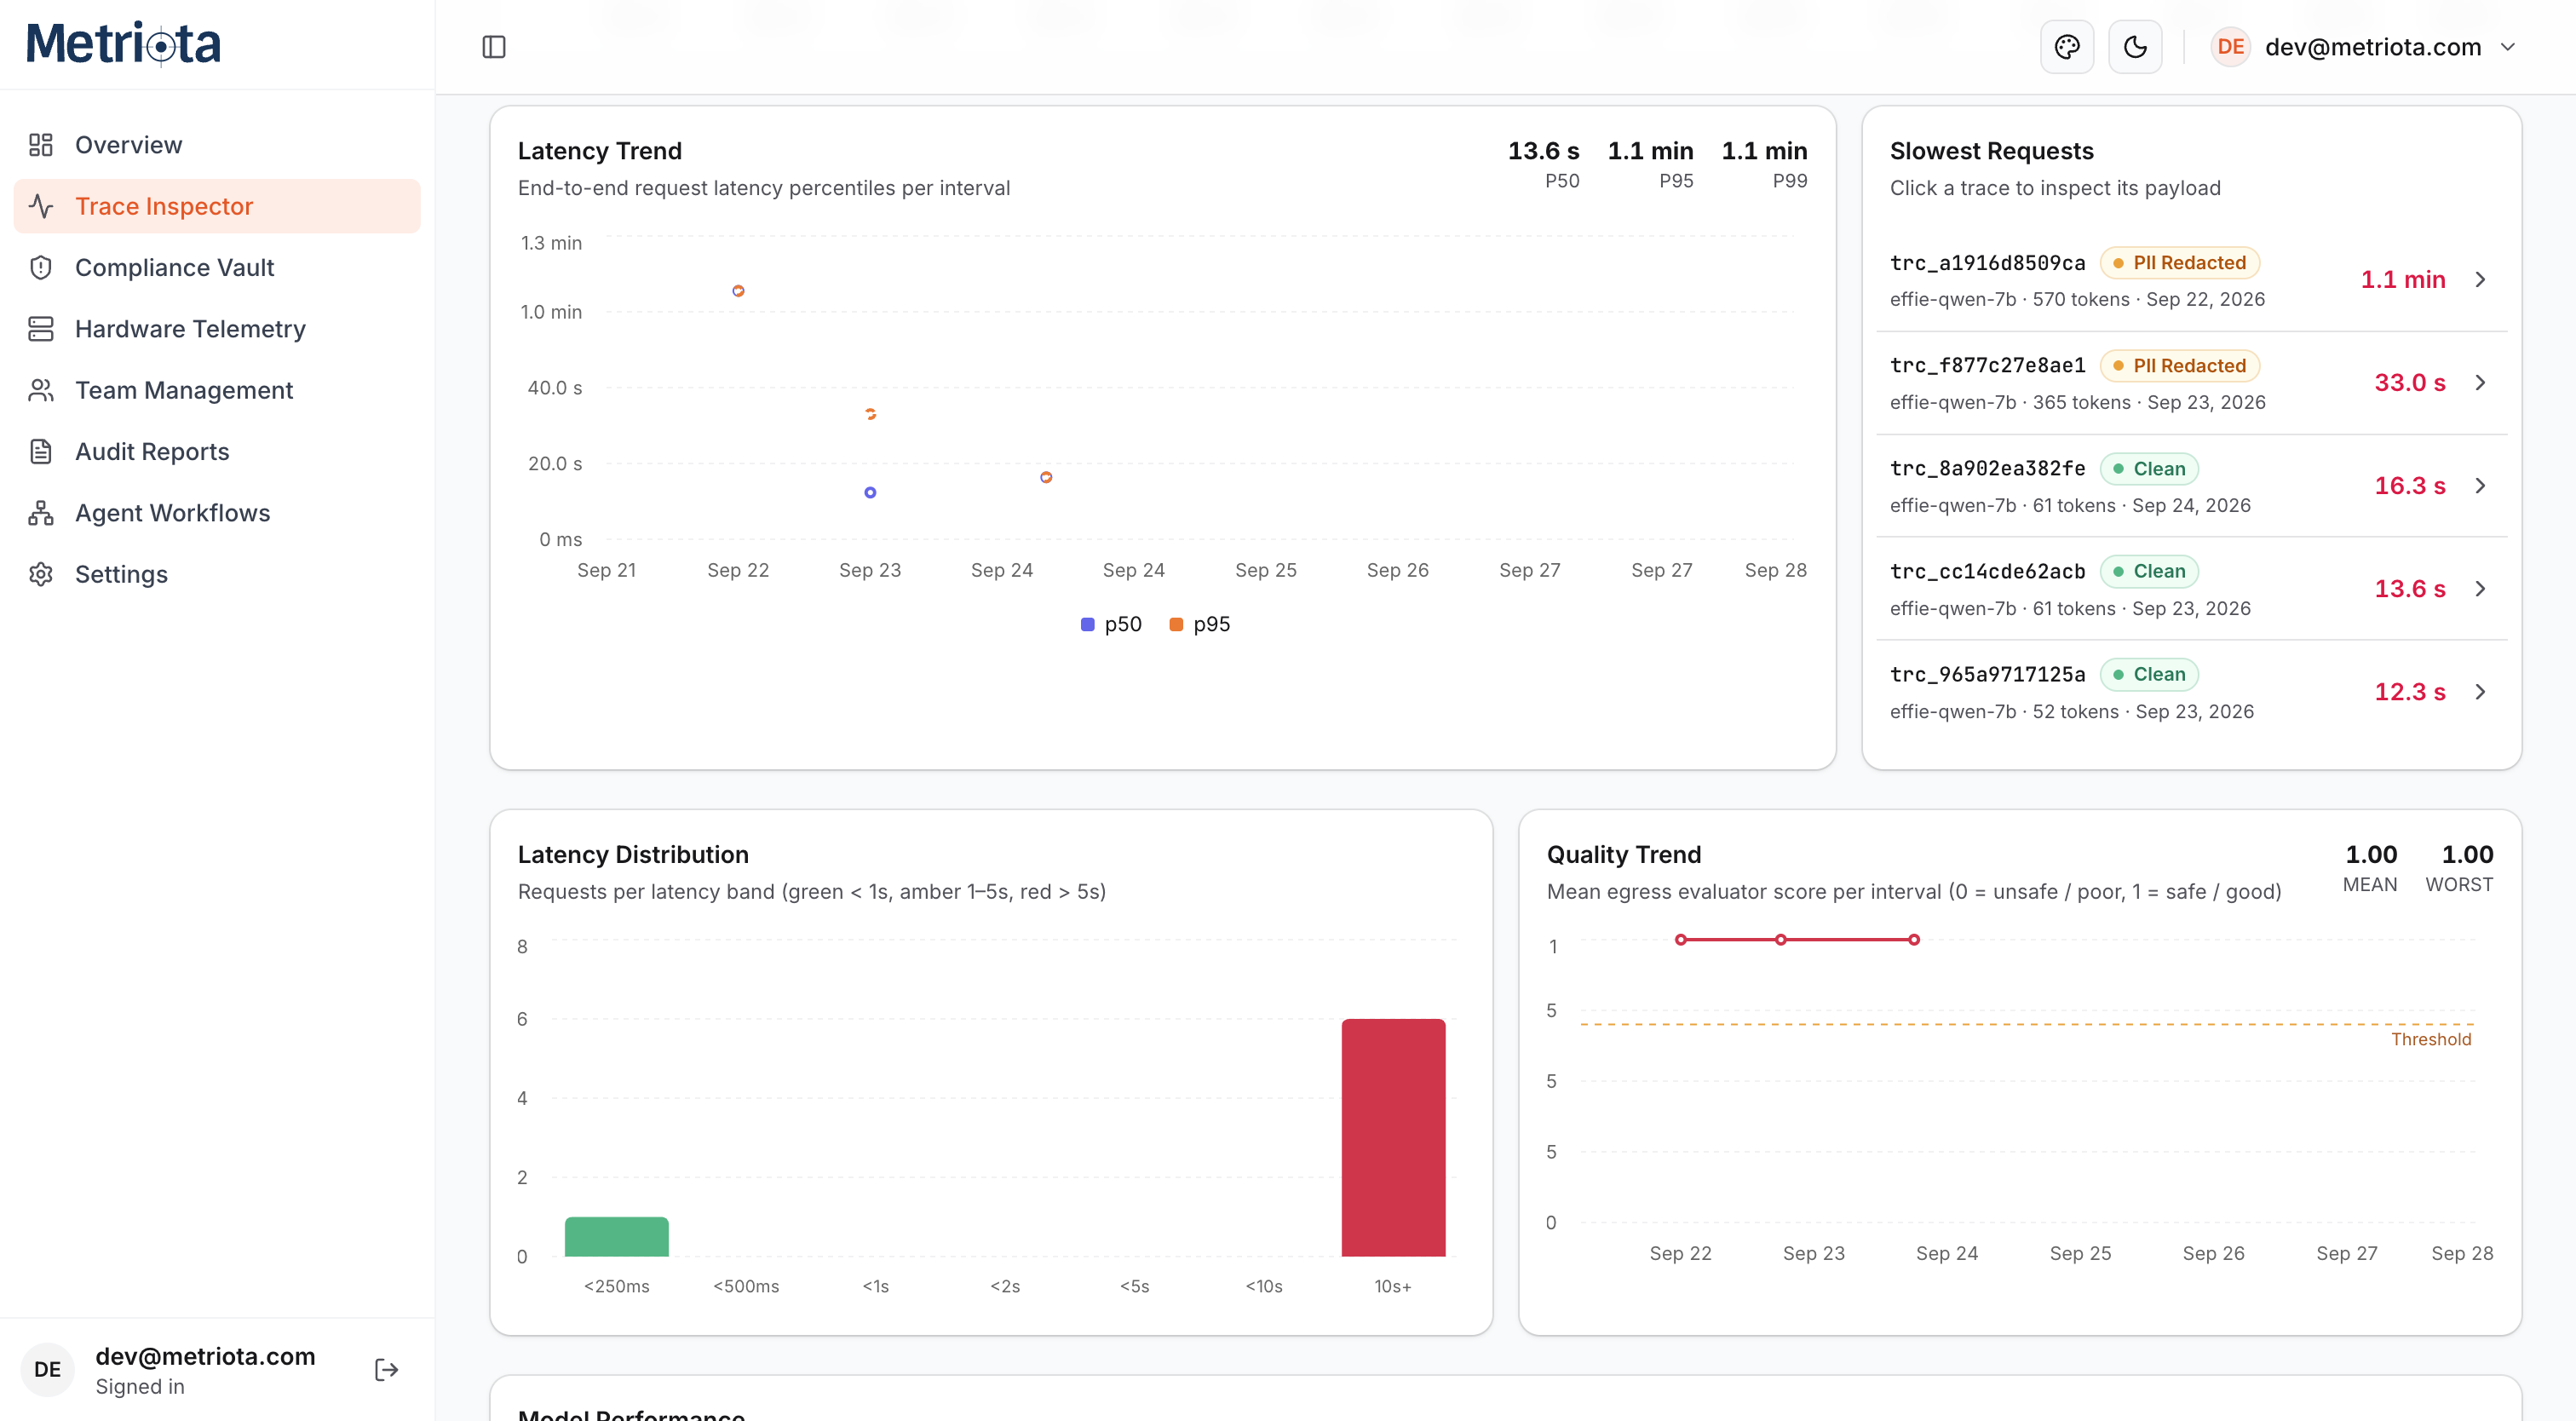
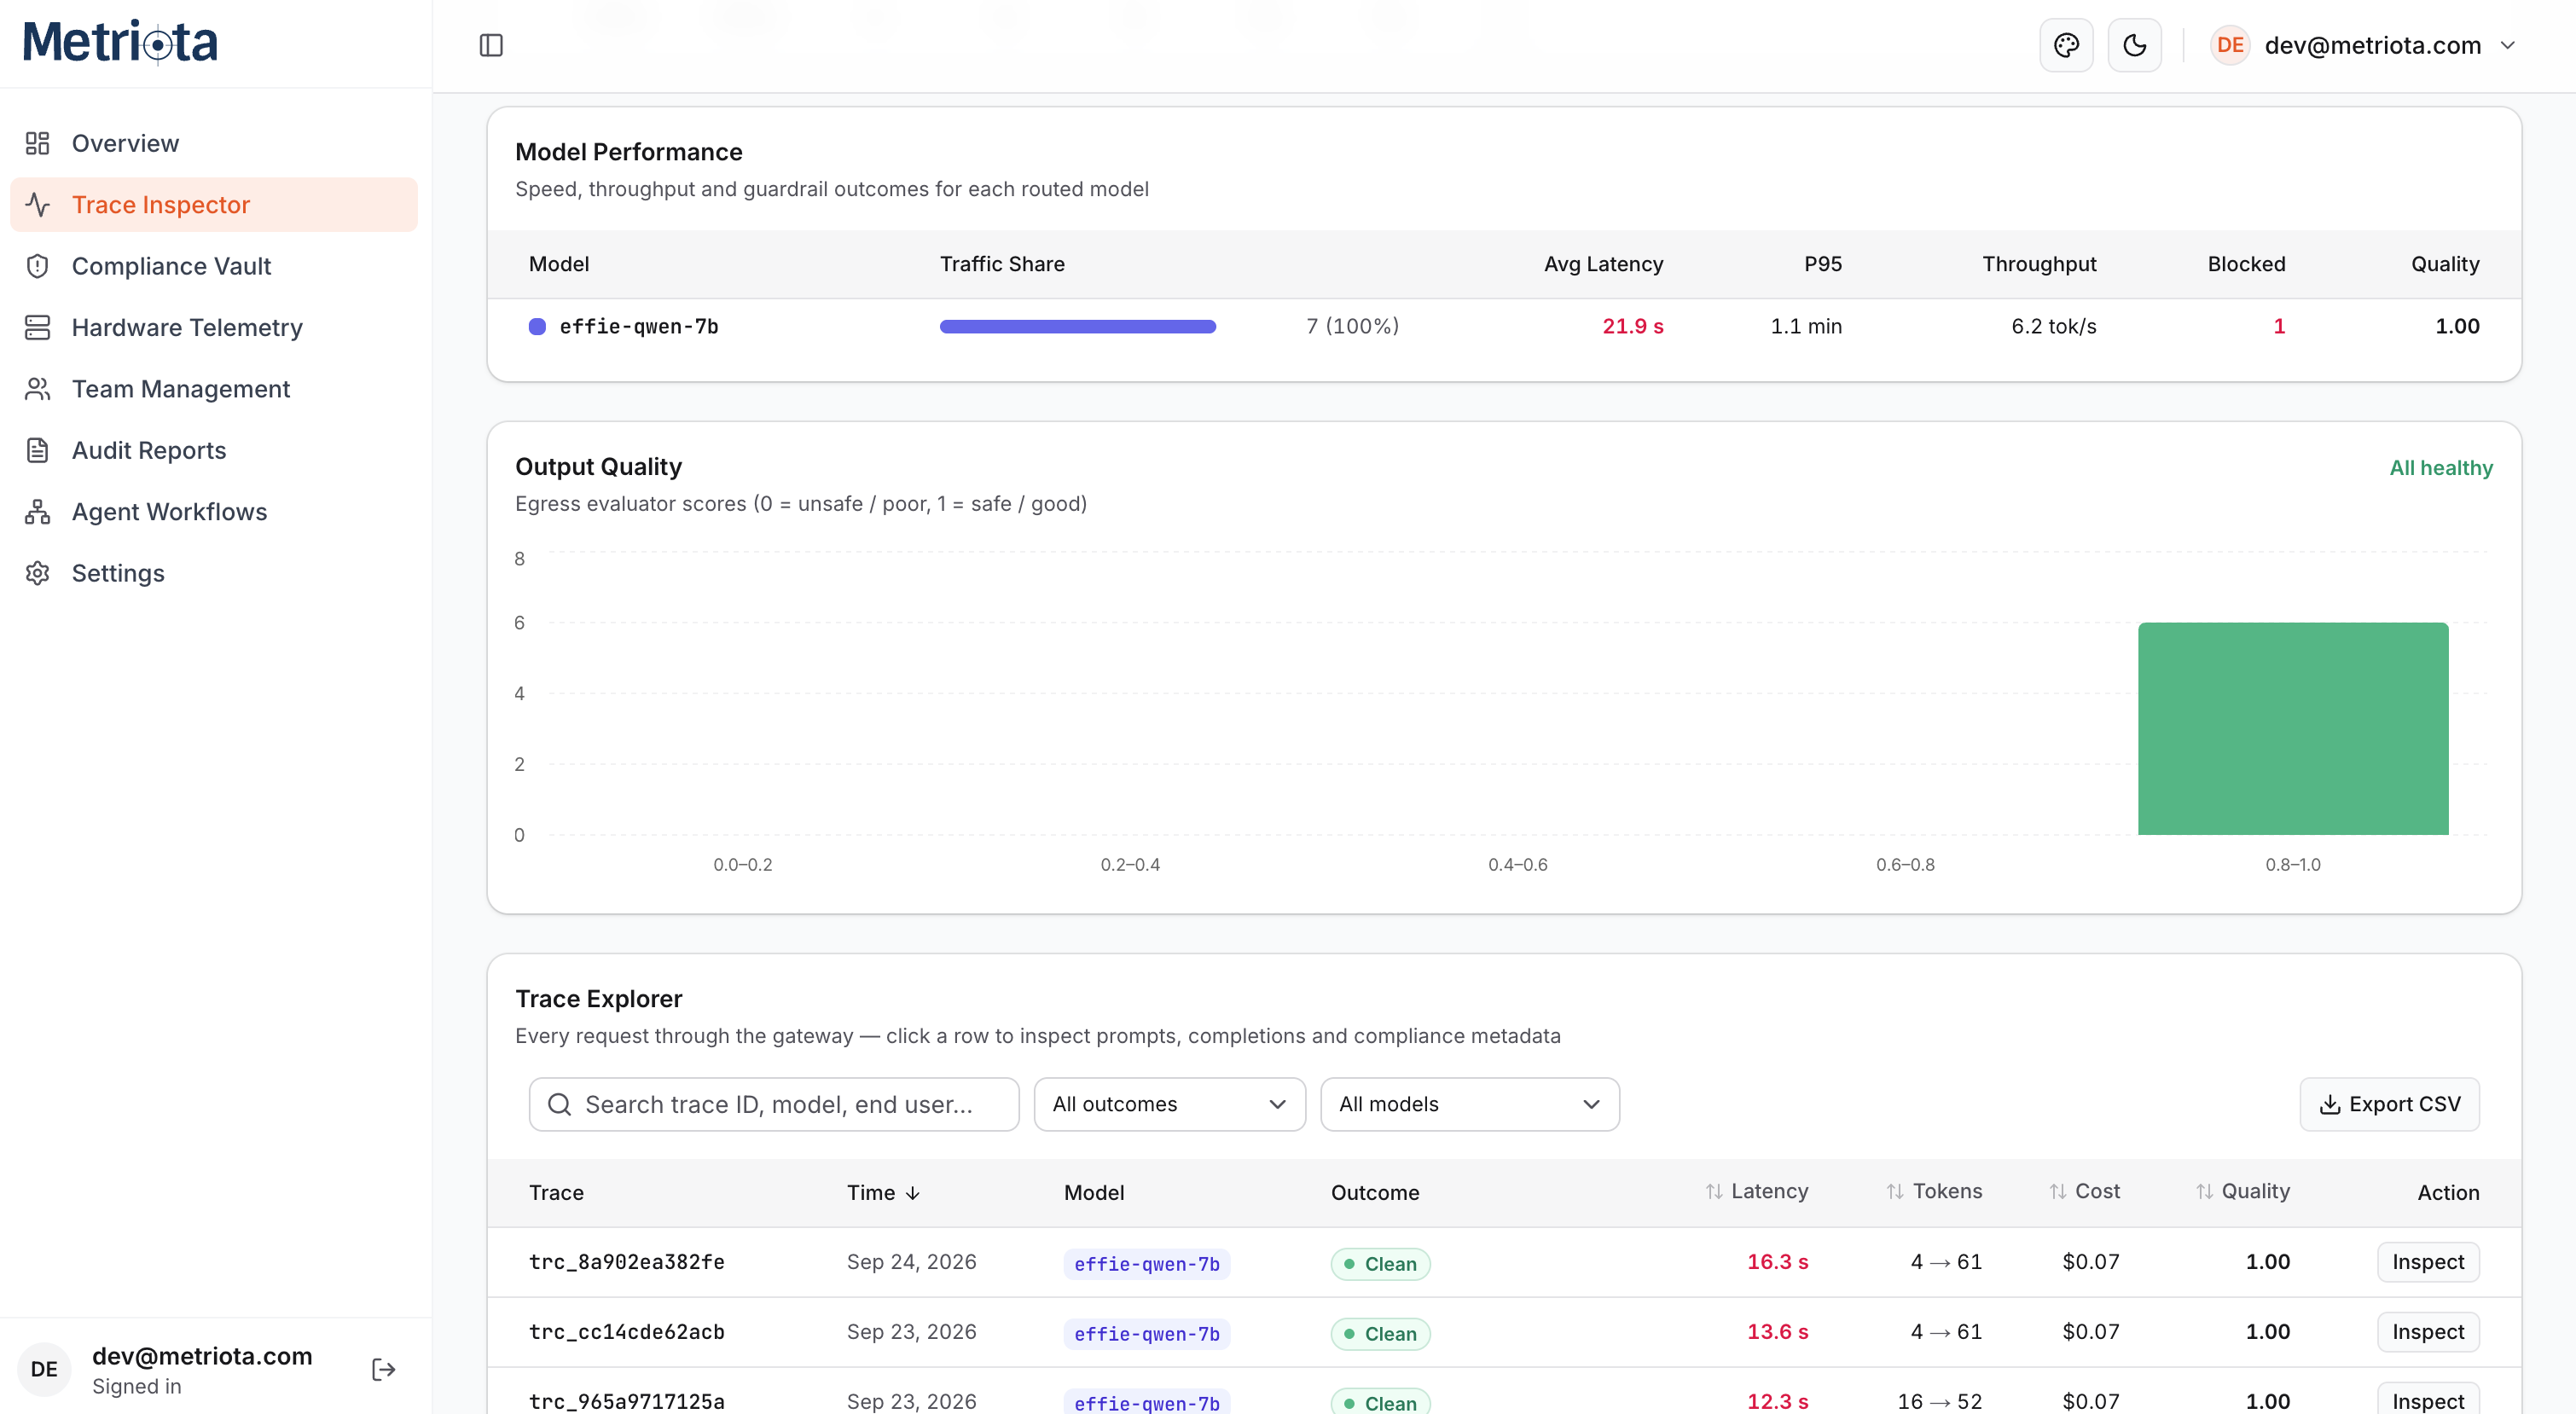
Overview is your first stop for a health check: total traffic, spend, guardrail activity, and model mix for the selected time window. When you need to look closer, Trace Inspector breaks that same traffic down into latency percentiles, output quality, and a searchable log of every individual request.
- Headline KPIs — total requests, average latency, guardrail interventions, total spend, local FinOps savings versus cloud rates, and active model count.
- Gateway Traffic & Guardrail Outcomes — requests, spend, and token usage per day, next to a share-of-decisions donut (clean, PII redacted, jailbreak blocked) and a two-hour-bucketed security timeline.
- Model Usage & Cost, Data Sovereignty, Top End Users — traffic share and spend per routed model, upstream routing by declared region, and your heaviest end users once requests carry an
X-End-User-Idheader.
- Pass rate & latency — P95 latency, time-to-first-token, decode throughput, and output quality at a glance.
- Request volume — total traffic split by outcome: clean, PII redacted, cache hit, or blocked.
- Latency & quality trends — percentile trends per interval, with the slowest requests and per-model performance surfaced automatically.
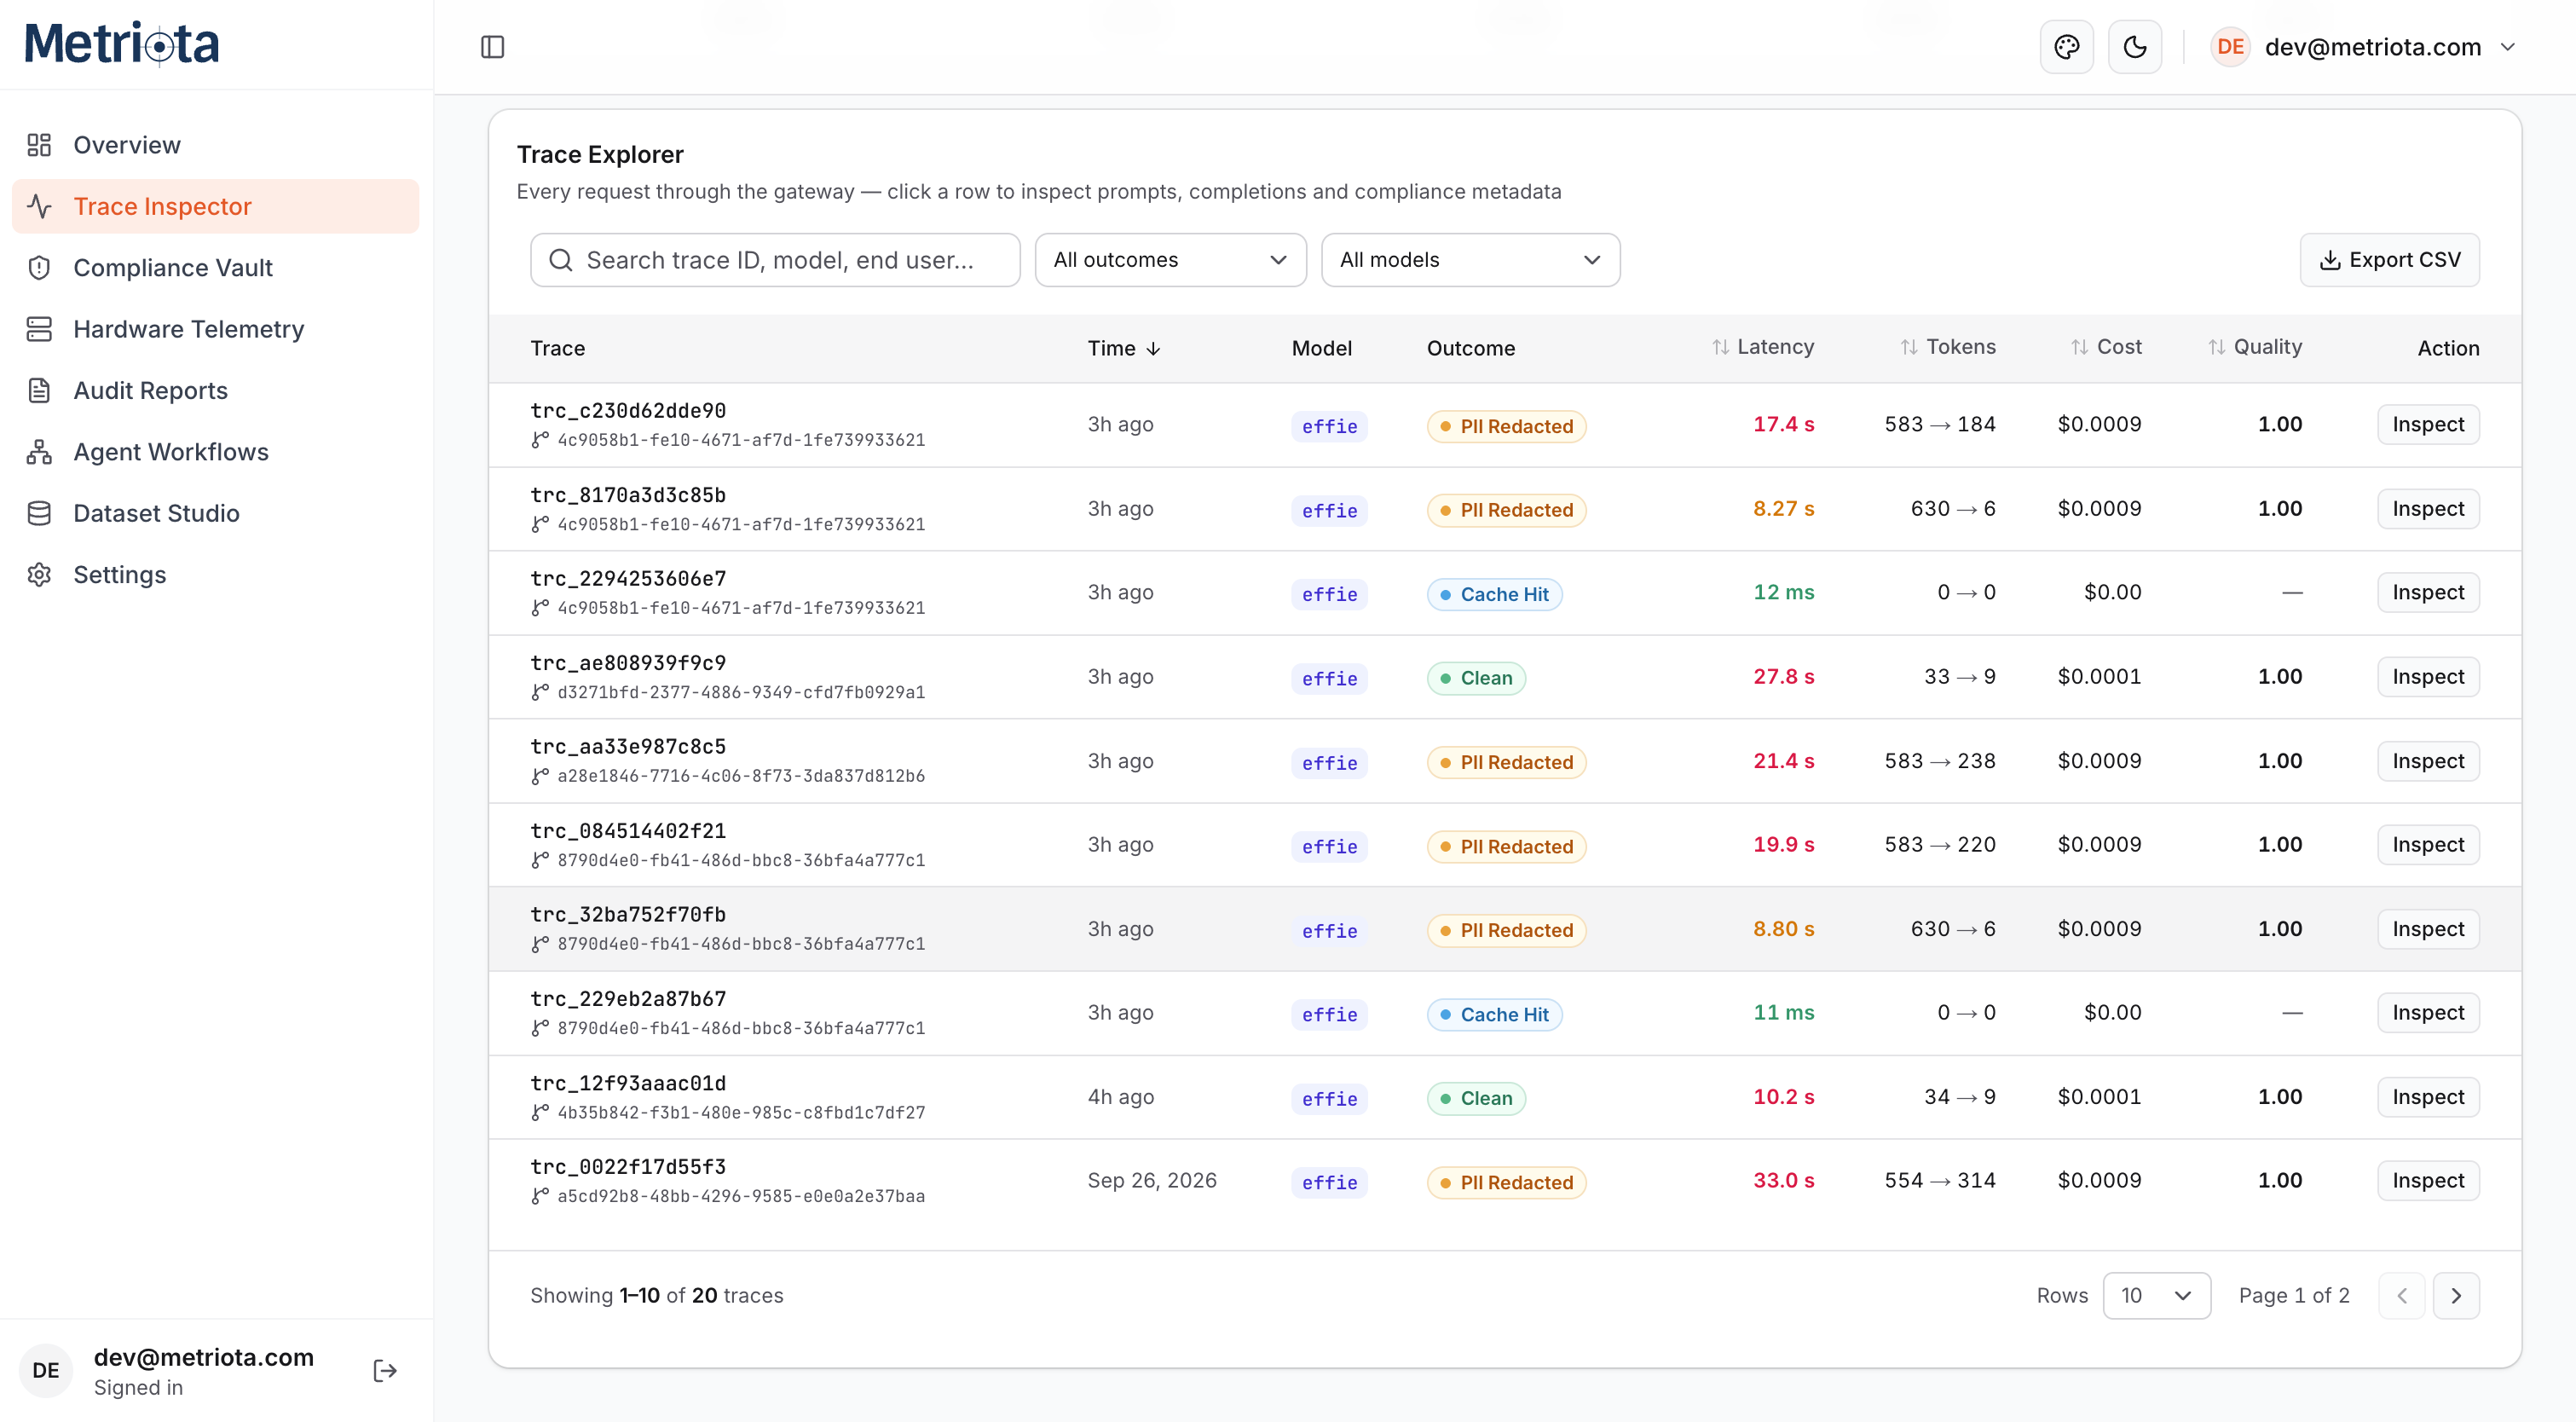
- Trace Explorer — search, filter, and export every request, then open one to inspect its full prompt, completion, and compliance metadata.
Agent Workflows
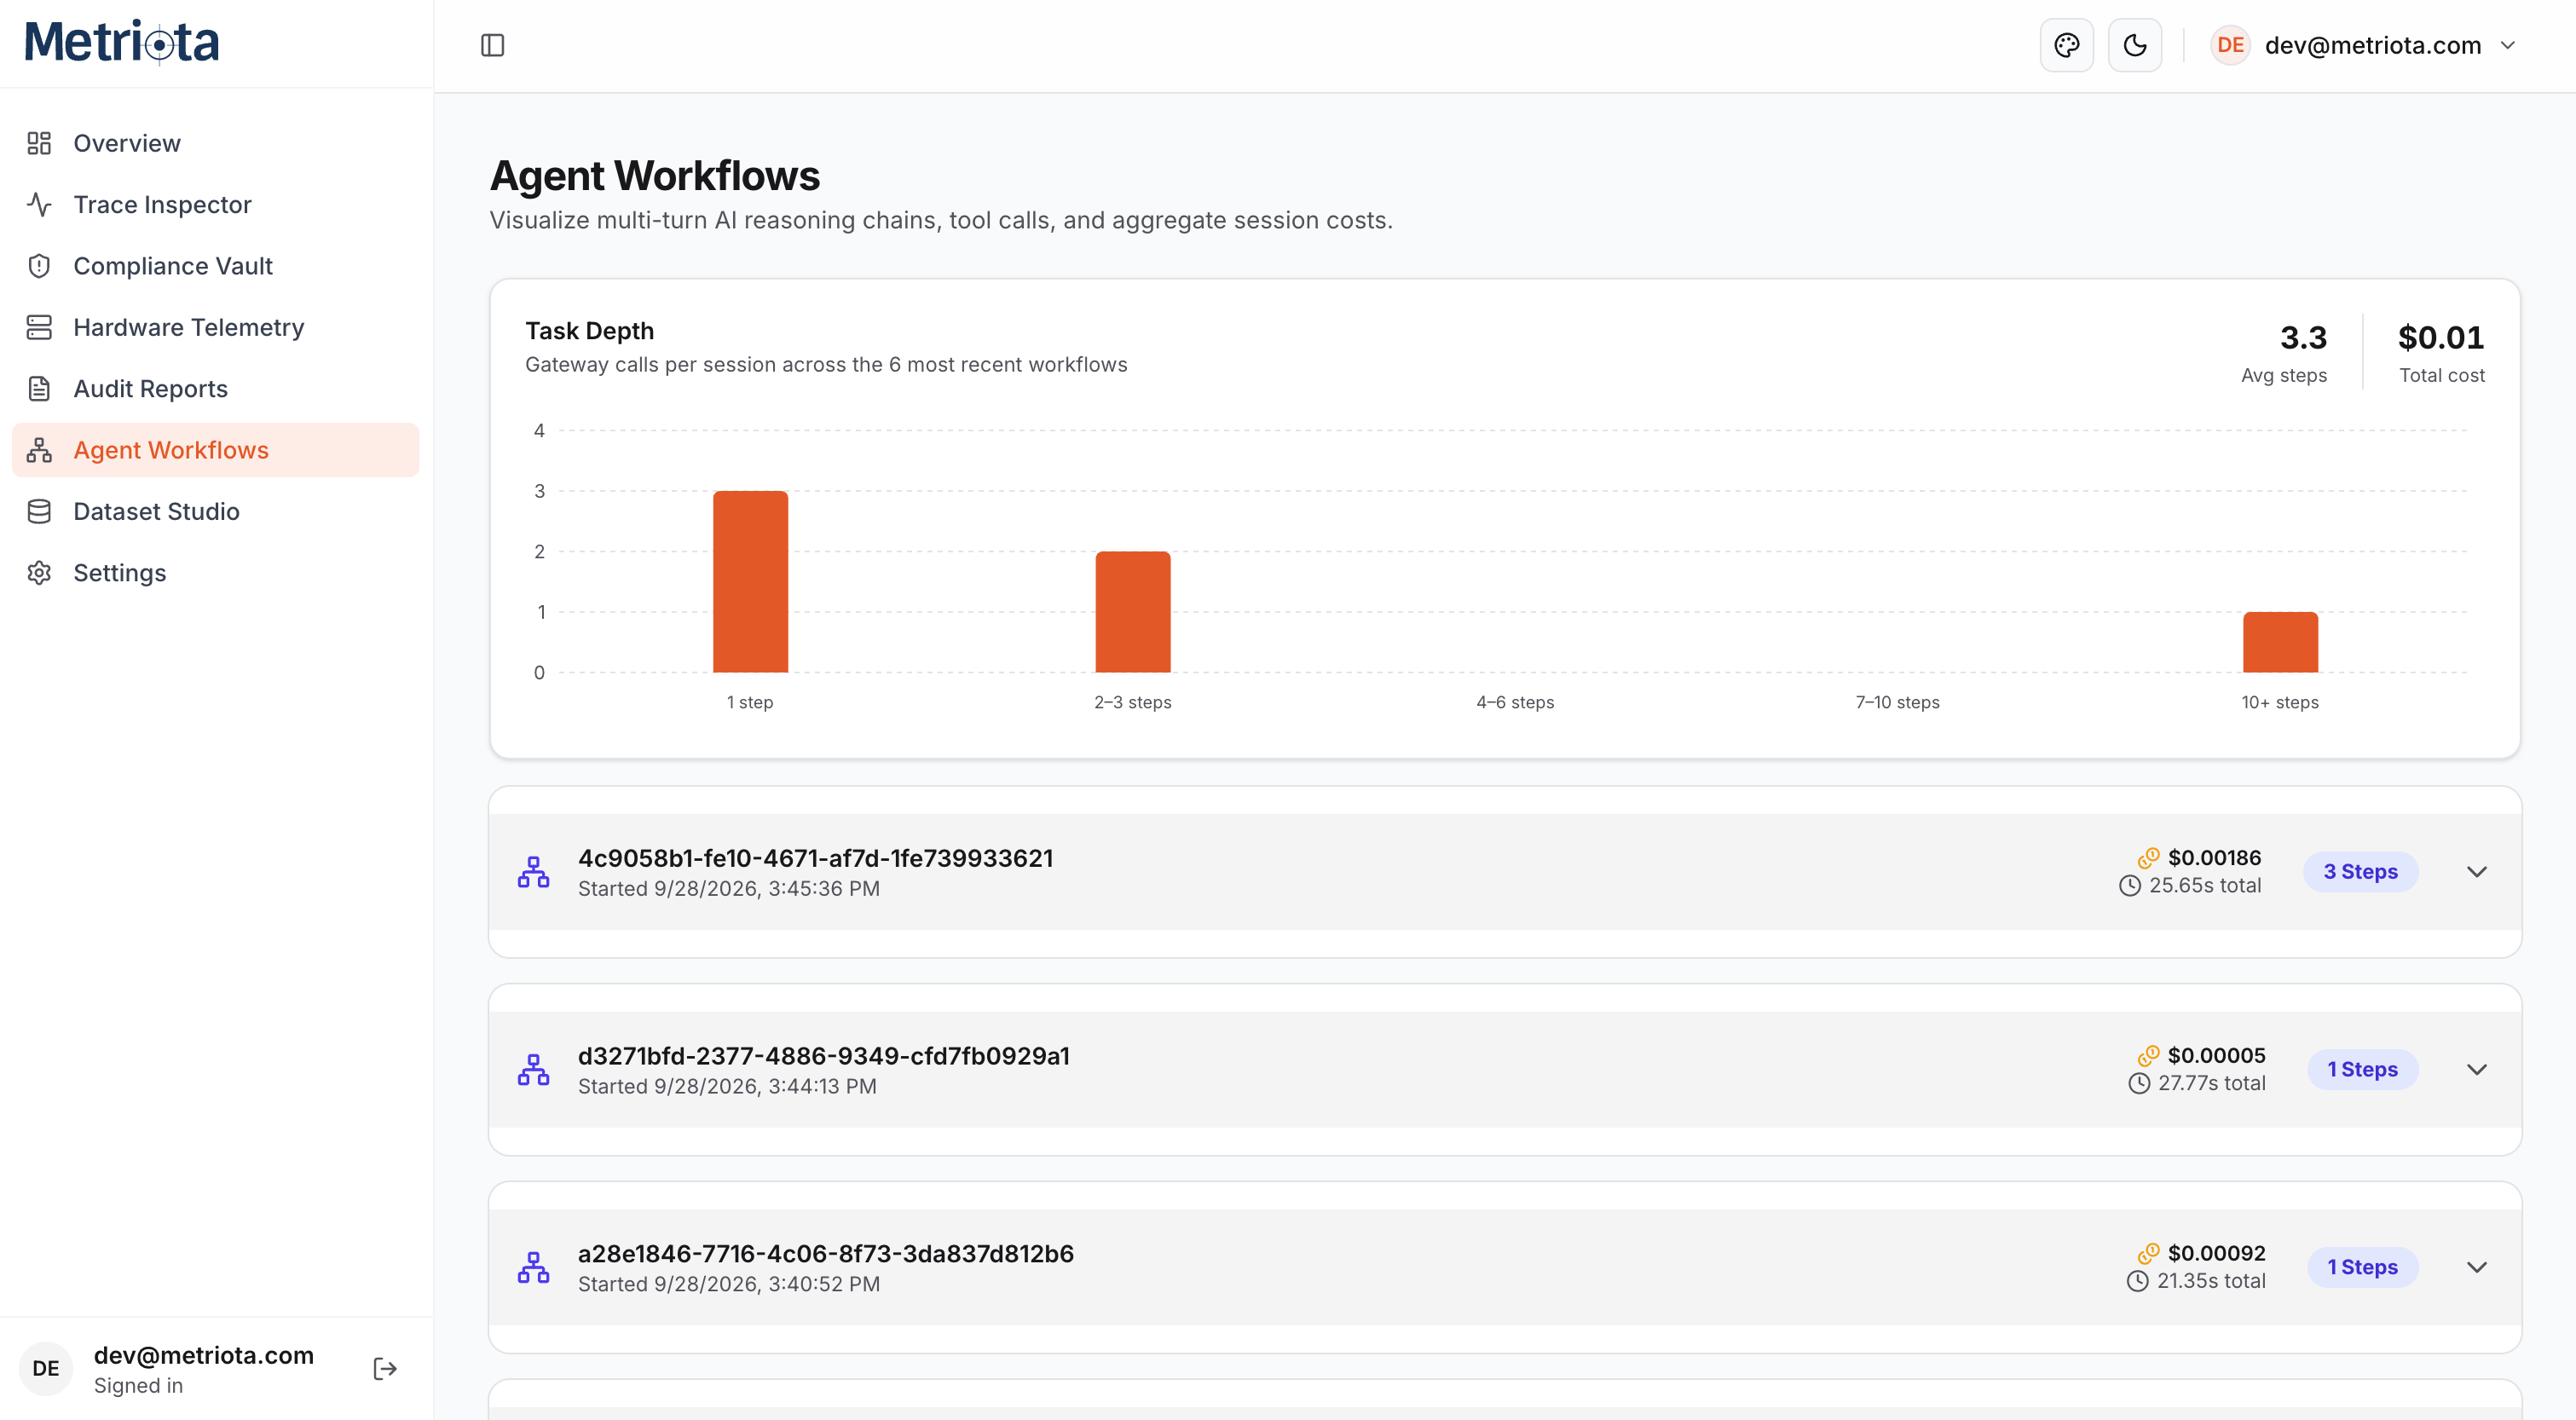
When an application chains several gateway calls into one task — an agent reasoning over multiple tool calls, a RAG pipeline retrying a step, a multi-turn assistant — Agent Workflows groups those calls back into a single session instead of leaving you to piece it together from individual traces.
- Task Depth — a histogram of gateway calls per session (1 step, 2–3, 4–6, 7–10, 10+), with the average step count and total cost across recent workflows at a glance.
- Session list — every workflow session by its correlation ID, start time, step count, total duration, and total cost; expand one to walk through each underlying call in order.
- No extra instrumentation — sessions are grouped automatically from gateway traffic. Send a stable correlation ID with each call in the chain and Metriota does the grouping; without one, calls close together in time from the same key are grouped heuristically.
This is the view for "why did this agent run cost $0.02 and take 25 seconds" — a question a single-request trace can't answer on its own.
Roles & Permissions
Every user belongs to exactly one of three roles. Nothing here is configurable per-user beyond these three — a member is promoted by having an admin recreate them as a client admin, or vice versa via the impersonation-free management screens.
| Role | Scope | Can do |
|---|---|---|
| Member | Own client only | View Overview, Trace Inspector, Compliance Vault, Hardware Telemetry, Agent Workflows, and Audit Reports for their client. Read-only roster in Team Management. No access to Settings. |
| Client Admin | Own client only | Everything a Member can, plus full Settings access (routes, guardrails, API keys) and full Team Management (add/remove teammates, reset passwords, activate/deactivate) — always scoped to their own client. |
| Super Admin | Every client | Everything above, for any client. Plus Client Management (create/deactivate clients), User Management (a flat, cross-tenant view of every user), Dataset Studio, and the ability to impersonate a user for support, with a required justification that's logged. |
Team Management
Team Management is scoped to your own client and visible to everyone on it. A Client Admin sees full manage actions; a Member sees a read-only roster.
- Add a teammate — set an email and a temporary password. They sign in with it and are forced through the same change-password flow as the client's original admin.
- Activate / deactivate — instantly revokes or restores sign-in access, without deleting the account or its trace history.
- Reset password — issue a new temporary password on their behalf; they'll be walked through setting their own on next sign-in.
- Remove — permanently removes an active member from the client (disabled for admins, to avoid locking a client out of its own account).
Every client has a user limit set at creation (default 3); only active users count against it, so deactivating someone frees a seat immediately.
Client Management
Visible only to super admins. This is where a new organization enters Metriota — see Client & User Onboarding for the full walkthrough. Beyond creation, this screen is also the cross-client control surface:
- Manage users inline — expand any client to add, deactivate, reset the password for, or remove its users without leaving the list.
- Impersonate — sign in as a specific user for support or debugging. Requires a written justification, which is stored in the admin action log alongside the target user and timestamp.
- Deactivate a client — immediately signs out and blocks every user on that client from signing back in, without deleting their data. Reversible at any time.
- User Management — the same actions, but as one flat table across every client at once, with a client column so you can see who belongs where. Useful for platform-wide support work that isn't scoped to a single client.